INTRODUCTION
Subarachnoid hemorrhage (SAH) is an accumulation of blood in the subarachnoid space after the rupture of a cerebral aneurysm. It is associated with high mortality and morbidity rates [1,6]. The annual incidence of aneurysmatic SAH (aSAH) is nine cases per 100000 people [6,15,16,18].
The etiology of SAH is divided into traumatic and non-traumatic causes. The latter kind is more common, and 85% of these are caused by intracranial aneurysm rupture. The remaining 15% of cases do not have any vascular lesions. Hypertension (HT), smoking, family history, and history of previous bleeding aneurysms are major risk factors for ruptured intracranial aneurysms [21].
The prognosis for SAH is determined by factors such as sex, HT, the presence of an aneurysm or diabetes mellitus (DM), and medication use [6,16,18]. The mortality rate is between 17% and 50% [15,16,18]. SAH also causes morbidities that require care or prevent the patient from returning to work [18].
The leading cause of mortality and morbidity after aSAH is delayed cerebral ischemia (DCI), mainly caused by vasospasm [1]. Vasospasm is a reaction to arterial rupture followed by the narrowing of the vesselвҖҷs lumen [5,7]. It occurs on the third day after a SAH, peaks on approximately the seventh day, and persists for 2 weeks. Its pathophysiology involves the nitric oxide (NO) pathway. NO causes an increase in intracellular calcium (Ca2+) through the production of cyclic guanosine monophosphate, relaxation of smooth muscle cells, and vasodilation in the main cerebral arteries4). Vasospasm is the most common complication of a SAH and requires urgent treatment [5]. It can be diagnosed clinically and angiographically, but the gold standard criterion is cerebral angiography : angiographic vasospasm can be seen in 70% of patients with an aSAH, whereas clinical vasospasm is seen in 20-30% of patients [9].
Predictive and prognostic factors for outcomes in patients with SAH are still unclear [16]. However, the World Federation of Neurological Surgeons (WFNS) scale, which is calculated based on factors such as motor deficit and the patientвҖҷs Glasgow coma scale (GCS), has prognostic value [18]. In addition, inflammatory markers are important indicators in outcome prediction and prognosis [1,19].
The SAH mechanism starts with leukocytosis and platelet activation, stimulating an inflammatory response that causes brain damage and, eventually, vasospasm. At this point, thrombosis is induced, inflammatory molecules are released, neutrophils increase the inflammatory response, damage occurs to the blood-brain barrier, inflammatory mediators are released, and monocytes interact with platelets and endothelial cells, promoting inflammatory and thrombotic pathways. In contrast, lymphocytes play an important role in the anti-inflammatory response [19].
System inflammation can be detected by the systemic inflammatory response index (SIRI) and the systemic inflammatory index (SII), which are used in the prognosis of several types of cancer [19]. The neutrophil-to-lymphocyte ratio (NLR) indicates inflammation and can be used as a predictor of tumors and cardiovascular disease [2]. The NLR primarily reflects inflammatory damage, whereas SII provides overarching information on inf lammation, hemostasis, immunity, and thrombosis [14]. Recent studies have found significant associations between increased SIRI, SII, and NLR values and poor cancer prognoses [2,19]. Inflammatory markers involving all these processes may help predict the aSAH prognosis [19].
This study investigated the relationship between inflammatory markers and cerebral vasospasm after aSAH and the contribution of SIRI, SII, NLR, and derived NLR (dNLR) indices in predicting clinical vasospasm.
MATERIALS AND METHODS
Ethics
This study was approved by the Trakya University Faculty of Medicine Scientific Research Ethics Committee (TГңTF-GOBAEK 2022/410).
Patient population
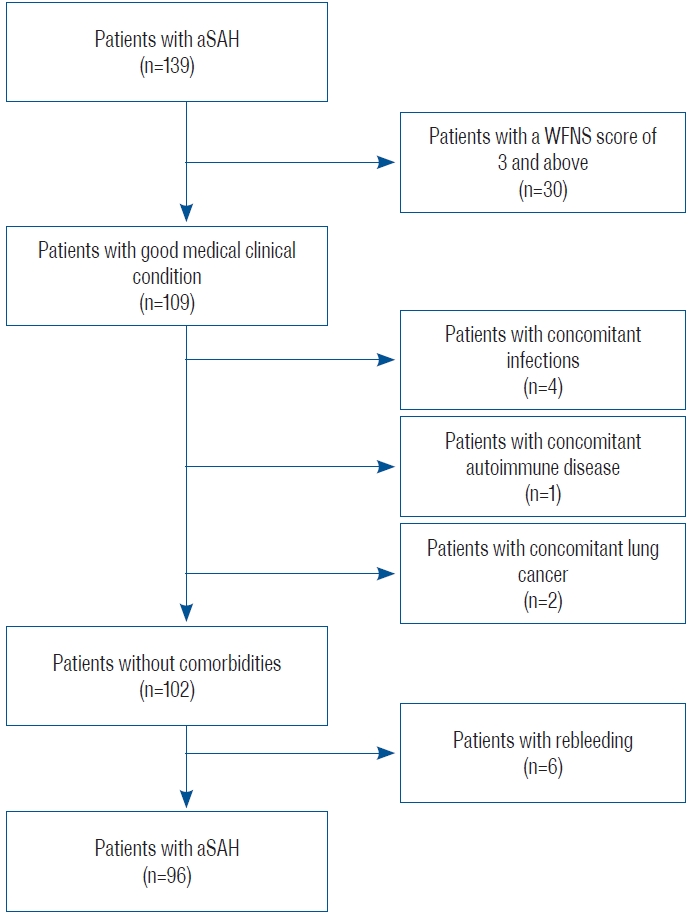
A retrospective analysis was performed on 139 patients admitted to Trakya University Hospital for aSAH between January 2013 and December 2021, of which 96 were included in this study. The inclusion criteria were as follows : 1) being diagnosed with aSAH and admitted to the hospital within the first 24 hours from the onset of the complaint; 2) WFNS stage вүӨ2; 3) no neurological deficit at the time of admission; 4) age >18 years; and 5) surgical clipping or endovascular treatment within the first 3 days after admission. Patients with any concomitant infectious disease, autoimmune disease, cancer, or rebleeding as a complication were excluded to ensure the homogeneity of the patient group (Fig. 1).
Technical analysis
Patients underwent non-contrast cranial computed tomography (CT) imaging of the SAH within the first 24 hours. Most were diagnosed with SAH by CT. A вҖңsuspectвҖқ group (not found to have SAH by CT) was subsequently diagnosed with SAH by lumbar puncture. After detecting a SAH, patients underwent cranial CT angiography (CTA) and/or four-system selective cerebral angiography.
Patients underwent daily neurologic examinations to determine DCI secondary to cerebral vasospasm. Since DCI is considered as a clinical entity, non-contrast cranial CT was performed, and wide laboratory parameters were examined in order to diagnose possible DCI in patients who developed focal deficit and/or decrease in level of consciousness. Potential causes such as infection, seizure, hydrocephalus, rebleeding, hypotension, metabolic disturbances that could explain the neurological deterioration were excluded. Patients with progressive decrease in GCS in consecutive follow-ups were considered as clinical vasospasm.
Digital subtraction angiography (DSA) was performed to confirm possible cerebral vasospasm in patients with neurological deterioration and clinical vasospasm.
Data collection
Patient information was collected from the hospital database. While collecting patient data, we considered the following topics : age, sex, medical history (DM and HT), neurologic status of the patient at admission (WFNS grading scale), Fisher scale, location and shape of the aneurysm, clinical vasospasm, transamine use, and surgical clip/endovascular.
Neurological examinations were performed by two neurosurgeons with 20 and 15 years of experience (B.T. and Y.A., respectively), and cerebral angiography was performed by an interventional neuroradiologist with 15 years of experience (O.K.).
Laboratory parameters
Counts of leukocytes (109/L), platelets (109/L), neutrophils (109/L), lymphocytes (109/L), and monocytes (109/L) were evaluated from standard blood tests obtained daily on admission and for the following 15 days.
SIRI, SII, NLR, and dNLR were calculated using the following formulas : SIRI = neutrophil count Г— monocyte count / lymphocyte count; SII = platelet count Г— neutrophil count / lymphocyte count; NLR = neutrophil count / lymphocyte count; dNLR = (leukocyte count вҲ’ neutrophil count) / lymphocyte count.
Statistical analysis
Results are expressed as meansВұstandard deviations or numbers (%). The StudentвҖҷs t-test was used to compare age variables between the non-vasospasm (NVS) and vasospasm (VS) groups. The chi-square test was used to compare categorical variables (sex, past medical history, aneurysmal location, aneurysm morphology after rupture, clinical scores, tranexamic acid, and surgical modality) between the NVS and VS groups. The diagnostic accuracy of the laboratory parameters was assessed using receiver operating characteristic (ROC) curve analyses. The area under the ROC curve (AUC) and cut-off values for the laboratory parameters and sensitivity and specificity values were calculated. A result with p<0.05 was considered statistically significant.
RESULTS
This study included 96 patients, of whom 66 were in the NVS group and 30 were in the VS group. The mean age was 54.6Вұ13.6 years in the NVS group and 54.9Вұ12.1 years in the VS group (p=0.893). The numbers of males and females were 34 and 32 in the NVS group and 13 and 17 in the VS group, respectively. The medical history, aneurysm location and morphology, clinical scoring, tranexamic acid administration, and surgical modality variables of patients in the VS and NVS groups are detailed in Table 1.
Laboratory values were checked daily for all parameters. Cut-off, sensitivity, and specificity values were calculated on the day of admission and the following 15 days.
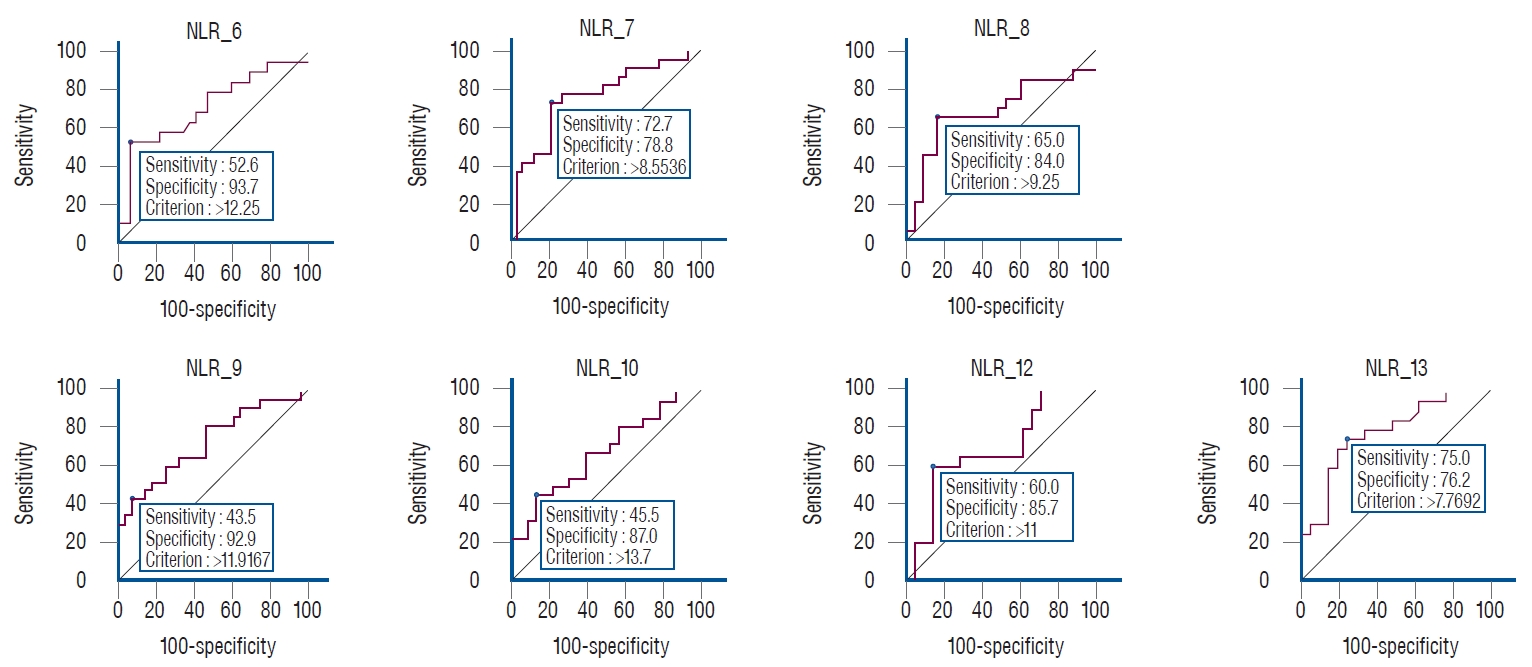
Statistically significant differences were found for the NLR on 7 days (6, 7, 8, 9, 10, 12, and 13). Cut-off values for each day were (Table 2) : day 6, >12.2 (AUC, 0.711; sensitivity, 52.6; specificity, 93.7; p=0.008); day 7, >8.5 (AUC, 0.756; sensitivity, 72.7; specificity, 78.8; p<0.001); day 8, >9.2 (AUC, 0.688; sensitivity, 65.0; specificity, 84.0; p=0.030); day 9, >11.9 (AUC, 0.733; sensitivity, 43.5; specificity, 92.9; p=0.001); day 10, >13.7 (AUC, 0.680; sensitivity, 45.5; specificity, 87.0; p=0.025); day 12, >11.0 (AUC, 0.688; sensitivity, 60.0; specificity, 85.7; p=0.029); and day 13, >7.7 (AUC, 0.785; sensitivity, 75.0; specificity, 76.2; p<0.001). Graphs of the days with significant differences in NLR are shown in Fig. 2.
A statistically significant difference was found for the SII only on day 9. The day 9 cut-off value was вүӨ156.1 (AUC, 0.666; sensitivity, 60.9; specificity, 85.7; p=0.048; Table 2). No statistically significant differences were found for the SIRI (Table 2).
Statistically significant differences were found for the dNLR on 3 days (2, 4, and 9). The cut-off values of these days were : day 2, >1.7 (AUC, 0.653; sensitivity, 80.0; specificity, 53.7; p=0.044); day 4, >1.8 (AUC, 0.695; sensitivity, 61.1; specificity, 77.8; p=0.011); and day 9, >1.5 (AUC, 0.704; sensitivity, 87.0; specificity, 50.0; p=0.006).
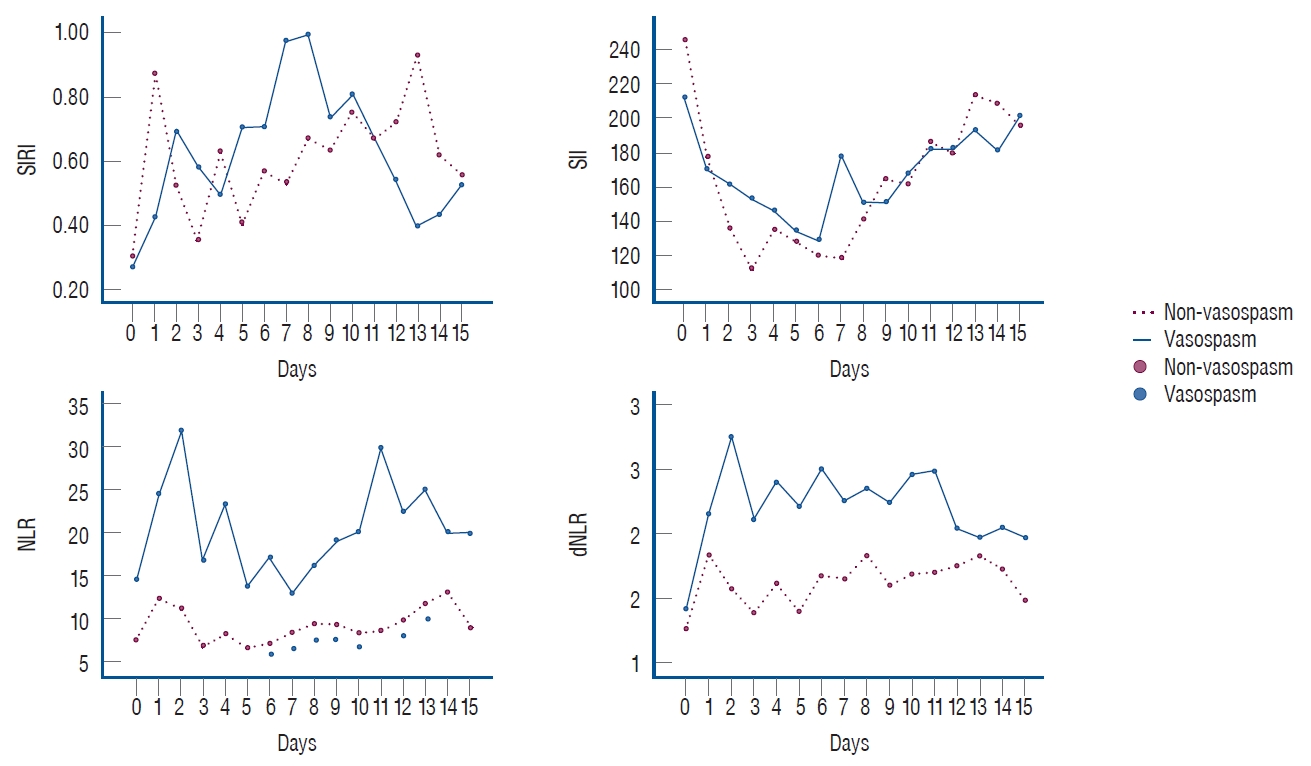
Fig. 3 shows the values of all markers calculated for each day.
DISCUSSION
In our study, the cut-off values for the NLR were statistically significant in detecting clinical VS, especially on the days with the most intense VS.
The patients included in this study were conscious and cooperative and did not have neurologic deficits at presentation. Therefore, neurologic deterioration was quickly recognized, and clinical VS was confirmed by performing DSA in these patients. In the literature, transcranial Doppler ultrasound (TCD) and CTA are used to evaluate VS. TCD is a method with low sensitivity and specificity because its imaging success in detecting VS is operator-dependent. The appropriate acoustic window cannot be found, meaning additional imaging is required [21]. In addition, CTA is more commonly used to visualize patients in the acute phase. CTA has higher sensitivity and is more helpful in predicting DCI [7,21]. However, the inability to perform an optimal neurologic examination in unconscious patients causes problems, such as not knowing the day CTA or DSA should be performed in this patient group and the impossibility of performing these methods daily. Therefore, published studies on VS are not very useful in daily practice because they do not specifically evaluate VS clinically, and angiographic VS is seen in more than half of this patient group. However, our study is the first in its field to use inflammatory markers and indices for clinical VS prediction and clinical VS diagnosis is supported by DSA, and it supports the diagnosis with more precise results.
As a result of current studies, neuroinflammation, which is involved in aSAH development, has also been suggested as an indicator of its clinical consequences and complications. Therefore, many studies have focused on inflammatory markers such as NLR, SIRI, or SII in the prognosis and prediction of aSAH [16]. The mentioned markers are cost-effective, not easily affected by many factors, sensitive and reliable in detecting most clinical changes, and easy to calculate. These advantages increase their usability in the treatment decision and process [16,17].
Feghali et al. [9] showed that the mean NLR value was higher in patients who developed VS, although the difference was not statistically significant (10.49 > 9.60). Giede-Jeppe et al. [11] performed a ROC analysis to differentiate unfavorable and favorable outcome prediction in patients with aSAH, determining a cut-off value for the NLR of 7.05. Its sensitivity was 74.5% and its specificity was 69.3%. Dowlati et al. [8] calculated the cut-off value as 8. Guo et al. [12] found the cut-off value for the NLR to be 12.03, while the AUC was 0.805 (p<0.001) in the ROC analysis. In the literature, ROC analysis has been calculated only for specific days or the moment of application, whereas in our study, values for each day were calculated for 15 days. In our study, the highest sensitivity for the NLR (75.0%) was on day 13, while the highest specificity was on day 6 (93.7%)вҖ”a high specificity value compared to the literature.
In addition to the above biomarkers, looking at the dNLR values is also valuable. We found that there was a significant difference on 3 days. However, we could not find a detailed study on this marker in the literature review.
While many previous studies have supported the NLR value in the prognosis of aSAH, others found the SIRI and SII values to be stronger prognostic factors. Yun et al. [19] found the cut-off value for the SIRI to be 3.2 (p<0.001), while Zhang et al. [20] found the cut-off value to be 4 (AUC, 0.671; sensitivity, 66.0%; specificity, 69.5%). In our study, no statistically significant difference was found for the SIRI. The good neurologic status of our patient group, and the fact that we worked with a smaller patient group to evaluate clinical VS, may have contributed to the lack of statistically significant differences in our study compared to those generally seen in the literature.
Chen et al. [3] found the cut-off value of the SII to be 1.424, while Geraghty et al. [10] calculated it to be 1.924 in patients with VS. Luo et al. [14] found the cut-off value to be 2344.65 (sensitivity, 66.7%; specificity, 75.0%; AUC, 0.692; p<0.05). In our study, a significant difference was found only on day 9, where the cut-off value was вүӨ156.1 (sensitivity, 60.9; specificity, 85.7; AUC, 0.666; p=0.048).
In the study by Geraghty et al. [10], the patients who developed VS were younger than those who did not. In the same study, the male sex ratio was higher in patients with VS [10]. In the study by Feghali et al. [9], 85% of aneurysms were evaluated to be located in the anterior circulation. Geraghty et al. [10] also found this location more frequently in those who developed VS. In the current literature, the relationship between comorbidities, especially DM and VS, has not been fully considered. While elevated blood glucose levels at hospital admission in patients with aSAH indicate its severe condition, it is not considered a predictor of VS [13]. In the study by Geraghty et al. [10], the proportion of patients with DM was similar in the group with and without VS. While no significant difference was detected in the same study, patients with HT were more common in the group that did not develop VS [10].
In the study of Geraghty et al. [10], patients with a high Modified Fisher score (grades 3 and 4) were more likely to be in the group with VS, while those with a low score were more likely to be in the group without VS. Those with higher GCS scores were mostly in the NVS group [10]. Our study found that the NVS group tended to be grade 2, and the VS group tended to be grade 3.
In our study, we found that certain clinical variables, including sex, age, aneurysm location, DM, HT, and various clinical and radiologic scoring systems, did not show statistically significant differences between the NVS and VS groups. This observation may be attributed to the specific patient population we selected, which mainly comprised conscious and cooperative individuals with good GCS and WFNS scores at presentation (grades 1 and 2). As we aimed to specifically evaluate clinical VS in this patient group, the lack of significant differences in these variables should be interpreted in light of the selected patient cohort.
Since our study was retrospective, we could not accurately assess how many days the biomarkers were significant before VS because we did not know exactly on which day clinical VS developed in some patients. In addition, systemic bias, a small sample size, and a single-center study design indicate the need for further studies. However, in most published studies, only the values at the time of hospital admission were considered. In contrast, separate cut-off values were obtained daily over 15 days in our study. In addition, this is the first study to use biomarkers and indices to evaluate clinical VS specifically.
CONCLUSION
With neuroinflammatory biomarkers, our knowledge of the innate immune components involved in the pathogenesis of aSAH can help predict prognosis and treatment decisions. These are not biomarkers that can be used alone. However, combined with parameters such as radiology or scoring scales, they may help determine severity and prognosis at admission, more active patient follow-up, and more precise treatment. Further studies with larger patient groups will shed more light on this issue. Instead of costly and labor-intensive tests, markers calculated from blood samples that are routinely performed and cost-effective encourage these studies.