INTRODUCTION
Glioma is the predominant type of primary intracranial tumor globally, representing approximately 80% of primary malignant brain tumors, exhibiting significant mortality and morbidity rates [5,8]. Despite the implementation of aggressive radiotherapy and chemotherapy regimens next to gross total resection, early relapse and elevated lethality rates remain substantial challenges in glioma which can be attributed to the remarkably proliferative and aggressive characteristics of glioma. Thus, enhancing the fundamental molecular mechanisms in glioma progression and ascertaining potential therapeutic targets is necessary.
The presence of supernumerary centrosomes during mitosis resulted in cell death [3,16]. However, growing evidence has substantiated the capacity of cancer cells to effectively engage in mitosis via the aggregation of extra centrosomes, resulting in the formation of two fully operational spindle poles [14,16]. Kinesin family member C1 (KIFC1), a non-essential kinesin-like motor protein, has been previously documented to play a critical role in intracellular transportation, clustering of supernumerary centrosomes and, consequently, the survival of cancerous cells [12,22]. Thus, KIFC1 has appeared as an attractive research hotspot and potential therapeutic target for various cancer types, including lung, bladder, prostate, breast, and hepatocellular carcinoma [7,15,17,23,30].
In a previous investigation, bioinformatics analysis was employed to verify that the expression of KIFC1 was observed to be upregulated in grade III glioma [4]. However, the clinical significance and biological roles of KIFC1 in glioma have yet to be elucidated. Therefore, this study aimed to assess the expression levels of KIFC1 in both glioma and normal brain tissues via bioinformatics analysis and clinical tumor specimens. Moreover, a series of in vitro experiments were conducted to examine the impact of KIFC1 knockdown on the cellular mechanisms regulating glioma progression.
MATERIALS AND METHODS
This study was conducted with the approval of the Ethics Committee of Liaocheng People’s Hospital, and written informed consent was obtained from each patient or their family member.
Patient studies
In this study, 105 glioma tissues were collected from patients pathologically diagnosed with glioma and underwent surgical resection at Liaocheng People’s Hospital from January 2015 to April 2017 (Table 1). Two pathologists independently confirmed the pathological diagnosis following the 2007 World Health Organization Classification of Nervous System Tumors [18]. All excised tumors were classified as treatment-naive, including previous radiation or chemotherapy exposure. Patients who previously underwent tumor resection were deliberately excluded from the study. Additionally, 12 normal brain tissues were obtained from trauma patients who underwent decompressive craniectomy during the same period. The sample consisted of six males and six females, averaging 47± 8.6 years. Exclusion criteria comprised patients with a medical history of prior administration of anti-tumor medications. After harvesting, all tissue specimens were promptly immersed in 10% formalin for immediate fixation for subsequent immunohistochemical (IHC) analysis.
IHC staining
Paraffin-embedded tissues were sectioned, deparaffinized via xylene, and rehydrated using a graded ethanol series. Antigen retrieval was performed by immersing the slides in a TrisEDTA buffer with 0.05% Tween 20 and incubated in a water bath at 100℃ for 30 minutes. The tissue sections were incubated with a 3% H2O2 to inhibit the function of endogenous peroxidase. After washing with phosphate buffered saline (PBS), the tissue sections were blocked to prevent non-specific binding via a blocking buffer comprising 0.3% goat serum (SigmaAldrich, St. Louis, MO, USA; Merck KGaA, Darmstadt, Germany) diluted in skimmed milk in PBS for 20 minutes. These sections were incubated overnight with an anti-KIFC1 antibody (1 : 100; ab15580; Abcam, Cambridge, UK) in a solution of 10% rabbit serum (Sigma-Aldrich; Merck KGaA). After washing with PBS, the tissue sections were incubated with horseradish peroxidase (HRP)-conjugated goat anti-rabbit immunoglobulin G secondary antibody (1 : 100; cat. no. ab6721; Abcam). The sections were counterstained with hematoxylin to facilitate the visualization of cell nuclei. Subsequently, a series of ethanol with varying concentrations were used to dehydrate the slides. Two independent pathologists verified these stained sections blindly under a light microscope (Olympus Corporation, Tokyo, Japan) at 200× magnification The staining intensity of each field, which represents the average intensity of positive cells, was assessed and scored as follows : 0 (none), 1 (weak), 2 (intermediate), or 3 (strong). A proportion score, indicating the percentage of positive cells, was scored as follows : 0 (none), 1 (≤1/100 staining), 2 (1/100 to 1/10 staining), 3 (1/10 to 1/3 staining), 4 (1/3 to 2/3 staining) or 5 (≥2/3 staining). The overall staining score, which comprises a range from 0 to 8, was determined by combining the intensity and proportion scores. A staining score of 0-3 was classified as negative KIFC1 expression, while a score of 4-8 indicated positive KIFC1 expression [11].
Cell culture
Human glioma cell lines U251 and U87MG were purchased from The Cell Bank of Type Culture Collection of the Chinese Academy of Sciences (Shanghai, China). The U87MG cell line was verified through short tandem repeat profiling and demonstrated that the U87MG cells employed in this study corresponded to the U87MG American Type Culture Collection cell line. This particular cell line is classified as a glioblastoma cell line, with undefined origin. Cells were allowed to grow in a medium consisting of RPMI-1640/DMEM (both Hyclone, Logan, UT, USA; Cytiva, Logan, UT, USA), supplemented with 10% fetal bovine serum (FBS) (Gibco; Thermo Fisher Scientific, Inc., Waltham, MA, USA) and 1% antibiotics solution (Gibco; Thermo Fisher Scientific, Inc.). The cells were maintained at 37℃ with 5% CO2. The culture medium was replaced at 72 hours.
Cell transfection
For cell transfection, two small interfering RNAs (siRNAs) targeting KIFC1 (KIFC1-si585, 5’-CCUGGAGCCUGAGAAGAAATT-3’; and KIFC1-si871, 5’-GGUCAGUUAUGUGACCUAATT-3’) and scrambled negative control (siNC, 5’-UUCUCCGAACGUGUCACGUTT-3’) were procured from Shanghai GenePharma Co., Ltd. (Shanghai, China). Approximately U251 or U87MG (2×10⁵ cells/well) were cultured into culture plate (6-well plate) in complete DMEM for 24 hours at 37℃ under 5% CO2 condition. Both cell lines were transfected with KIFC1-si585, KIFC1-si871, or siNC via Lipofectamine®™ 2000 (Invitrogen; Thermo Fisher Scientific, Inc.), following the manufacturer’s protocol. Cells were subsequently used for further experiments and the transfection efficiency was verified via western blotting.
Western blotting
Approximately 1×10⁷ cells were washed with cold PBS, and total protein was isolated via PRO-PREP protein extraction buffer (Intron Biotechnology, Inc., Seongnam, Korea). Total protein was quantified and 100 µg protein was separated via 10% sodium dodecyl sulphate-polyacrylamide gel electrophoresis (SDS-PAGE). The proteins were transferred onto polyvinylidene difluoride membranes and blocked with 3% bovine serum albumin for 2 hours at room temperature. These membranes were then incubated overnight at 4℃ with the following primary antibodies : anti-KIFC1 (Abcam), anti-microtubule-associated proteins 1A/1B light chain (LC3B; Cell Signaling Technology, Inc., Boston, MA, USA), and anti-β-actin (OriGene Technologies, Inc., Rockville, MD, USA). After the incubation with the primary antibody, the membranes were incubated with HRP-conjugated secondary antibodies (Cell Signaling Technology, Inc.) for 2 hours at room temperature. The enhanced chemiluminescence reagent visualized protein bands (Nanjing KeyGen Biotech Co., Ltd., Nanjing, China). Densitometric analysis was performed using ImageJ v2.4.1 software (National Institutes of Health, Bethesda, MD, USA).
Gelatin zymography assay
The secretion of MMP2 into the conditioned media was analyzed using gelatin zymography. After a 24-hour incubation in serum-free media, the conditioned media was centrifuged and subsequently resuspended in SDS loading buffer, excluding β-mercaptoethanol. Samples were run on electrophoresis with 10% SDS-PAGE gels that were copolymerized with 0.2% gelatin (Sigma-Aldrich; Merck KGaA). The gels were washed and incubated at 37℃ for 24 hours in a reaction buffer. Following this incubation, the gels were stained with Coomassie brilliant blue R-250 (0.25%). Subsequently, a de-staining process was carried out and the proteolytic activity of MMP2 was assessed by observing the distinct white bands with a molecular weight of 64 kDa against a blue background on the gel.
Cell multiplication (MTT) assay
Cell viability and metabolic rate were assessed using the MTT assay (Sigma-Aldrich, and Merck KGaA). The cells were allowed to grow into 96-well plates with 4×10³ cells/mL and incubated at 37℃ with 5% CO2. After the incubation period, 10 µL of MTT solution was introduced into each well, prepared by diluting 5 mg/mL of MTT in PBS. The optical density for each sample was detected utilizing a microplate reader (Bio-Rad 680; Bio-Rad Laboratories, Inc., Hercules, CA, USA) operating at 550 nm wavelength.
Imaging flow cytometry
Freshly isolated, untransfected, and transfected U251 and U87MG cells were extracted using trypsin digestion. Subsequently, these cells were incubated with anti-KIFC1 and antiLC3 antibodies for 30 minutes at room temperature. The stained cells were analyzed via Inspire software following flow cytometry (Amnis Corporation, Seattle, WA, USA), following the manufacturer’s protocol.
Wound healing assay
Cells were aseptically distributed into 6-well plates at 5×10⁵ cells per well, with a complete medium. When the cell culture reached a confluence of 90-95%, they were starved without serum for 24 hours. Subsequently, upon reaching a confluence of 95%, the cells were used for the subsequent experiments. A sterile pipette tip (200 µL) was used to induce a straight scratch wound in the monolayer of the cells. Following this, the plate was washed with PBS to remove any debris and detached cells. after scratch induction, the plates were incubated at 37℃ for 24 hours. Subsequently, images were acquired at 100× using a light microscope (Olympus Corporation). The distance of cell migration was measured at 24 hours via comparison with the initial time point at 0 hour.
Transwell invasion assay
Transwell invasion assay was conducted via Transwell chambers (Corning, Inc., New York, NY, USA), with the upper chambers being pre-coated with Extracellular Matrixgelatum. Approximately 5×10⁵ cells/well were cultured in serum-free DMEM and subsequently plated into the upper chamber. The lower chambers of the transwell plates were filled with 600 µL of DMEM supplemented with 10% FBS. Culture was incubated for 24 hours at 37℃ with 5% CO2. In the subsequent experimental procedure, invasive glioma cells were stained with 0.5% crystal violet. Following the staining, the cells were observed and quantified under a microscope (magnification, ×100; Olympus Corporation).
Bioinformatics analysis
The study used the Gene Expression Profiling Interactive Analysis (GEPIA) platform (http://gepia2.cancer-pku.cn/#index) to perform a virtual analysis of tumor/normal differential expression based on RNA expression data from The Cancer Genome Atlas (TCGA) and the Genotype-Tissue Expression (GTEx) databases. The main focus was to examine the differential expression of KIFC1 mRNA in glioma tissues [26]. GlioVis data portal (http://gliovis.bioinfo.cnio.es) was employed to investigate the mRNA expression levels of KIF1C in various glioma grades and assess the prognostic significance of KIF1C in glioma tissues [2].
Statistical analysis
Statistical analysis was performed via SPSS ver. 17 software (SPSS, Inc., Amonk, NY, USA). Data were reported as the mean±standard deviation of three independent experiments. A one-way analysis of variance was employed to assess the statistical disparities among the various groups. A significance level of p≤0.05 was determined as the statistical significance.
RESULTS
Using IHC staining, we demonstrated that the KIFC1 expression levels are upregulated in glioma and are positively associated with tumor pathological grade
IHC analysis was performed on 105 glioma tissues and 12 normal tissues obtained from Liaocheng People’s Hospital. The results revealed an upregulation of KIFC1 expression levels as the pathological grade of the tumor increased (Fig. 1A and B). GEPIA was employed to investigate the RNA-sequencing data from samples of 163 glioblastoma (GBM), 518 low-grade gliomas (LGG) from TTCGA, and 207 normal samples from the GTEx project. The findings demonstrated that the KIFC1 expression was significantly increased in both GBM and LGG samples when compared to normal samples (Fig. 1C). GlioVis data portal designed for the visualization and analysis of brain cancer expression datasets. The main focus was on the expression patterns of KIFC1 in gliomas of varying tumor grades, using data from the TCGA RNA sequencing database, which consisted of 152 GBM and 515 LGG samples. Besides, the Chinese Glioma Genome Atlas (CGGA) RNA sequencing database comprised 388 GBM and 625 LGG samples. The resultant outcomes revealed a significant correlation between the expression levels of KIFC1 and the pathological grade of glioma (Fig. 1D and E).
Prognostic value of KIFC1 in glioma via TCGA and CGGA bulk-RNA databases
GlioVis data portal, a comprehensive platform for the visualization and analysis of brain tumor expression datasets, was employed to examine the prognostic value of KIFC1 in glioma. This investigation involved utilizing RNA sequencing data from the TCGA and CGGA databases. As depicted in Fig. 1F and G, patients exhibiting low levels of KIFC1 expression demonstrated a more favorable prognosis compared to those with high levels of KIFC1 expressions (p≤0.001).
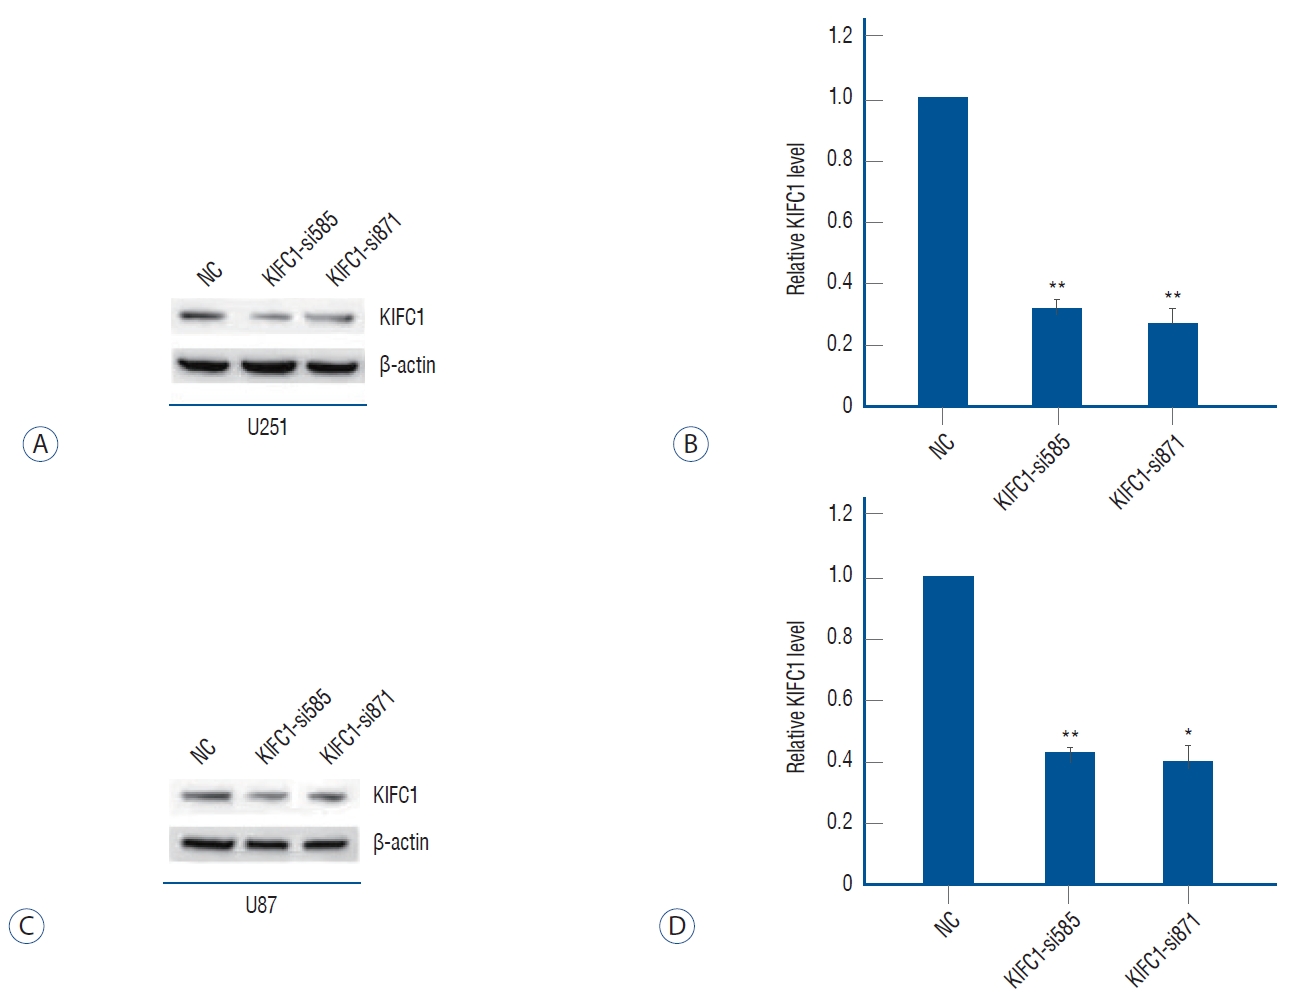
Using cell transfection and Western blotting : we had knockdown of the KIFC1 expression successfully
To elucidate the impact of KIFC1 in glioma, the expression levels of KIFC1 were knockdown in U251 and U87MG cells through transfection with KIFC1-si585 and KIFC1-si871. The transfection efficiency was assessed by a notable decrease in protein expression levels of KIFC1 in U251 and U87MG cells that were transfected with KIFC1 siRNAs compared to cells transfected with siNC (Fig. 2). U251 and U87MG cell lines were transfected with KIFC1-si871 and subsequently assigned as the experimental models for subsequent investigations.
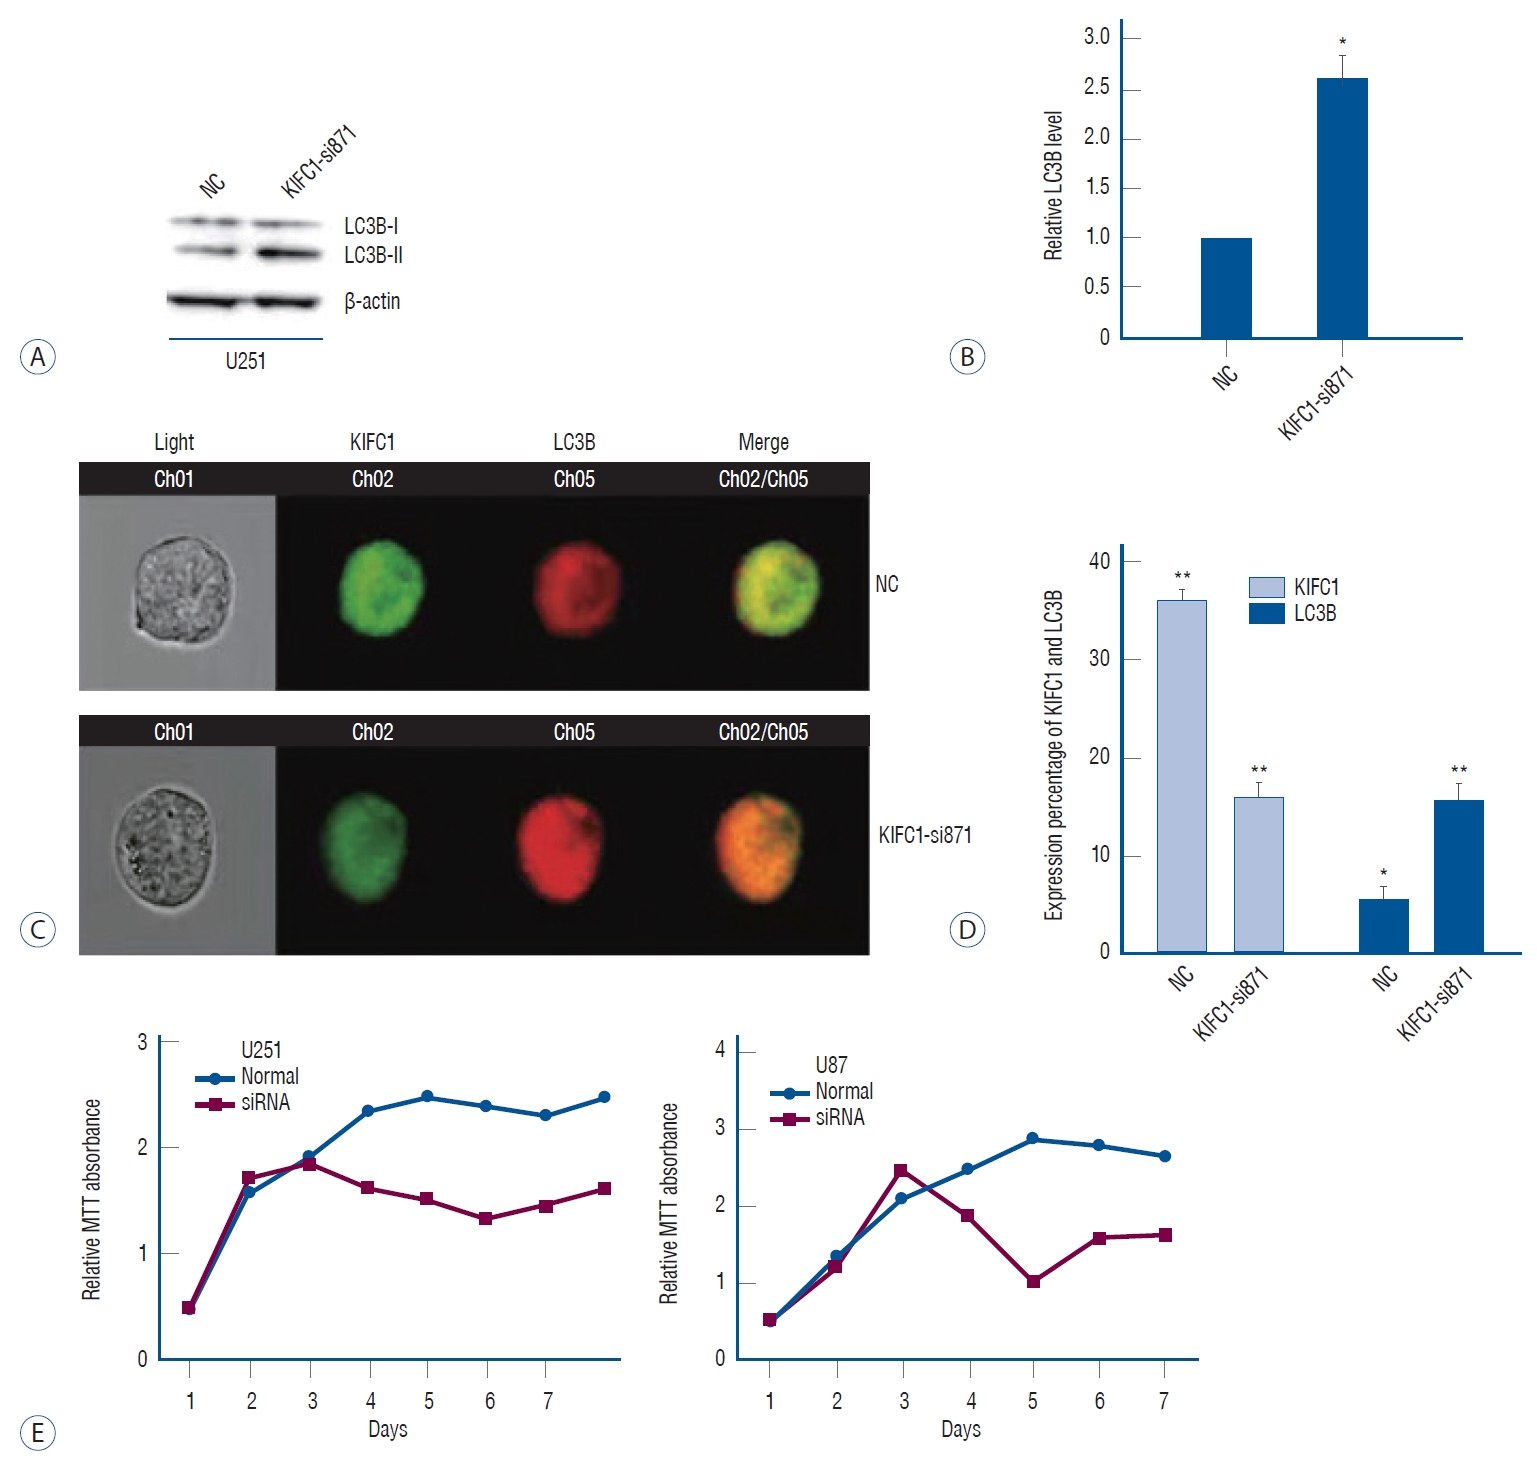
Using MTT assay and Imaging flow cytometry, we demonstrated that the KIFC1 knockdown inhibits the proliferation of glioma cells and increases the autophagic flux
The proliferative ability of untransfected and transfected cells was assessed using an MTT assay. In accordance with the findings depicted in Fig. 3E, the suppression of glioma cell proliferation was observed after the knockdown of KIFC1. The alterations in the autophagic flux, a vital modulator of cellular proliferation, were further examined via the implementation of western blotting and flow cytometry. To investigate the autophagic flux within glioma cells, the expression levels of LC3B, a well-established marker for autophagy, were examined. Western blotting analysis demonstrated a notable enhancement in the autophagic flux within the cells that were transfected with KIFC1-si871. This was evident by the upregulation of LC3B expression levels observed in the transfected cells compared to those transfected with siNC (Fig. 3A and B). In parallel, the findings of the flow cytometry also revealed an upregulation of LC3B expressions in cells with KIFC1 knockdown (Fig. 3C and D). These results elucidated the potential significance of KIFC1 overexpression in the proliferation of glioma cells while also suggesting a potential involvement of autophagy inhibition in this process.
Using Wound healing assay, Gelatin zymography assay and transwell invasion assay, we found that KIFC1 knockdown inhibits the migratory and invasive abilities of glioma cells and downregulates MMP2 expression
Migration and invasion are fundamental glioma characteristics strongly linked with infiltration, recurrence, and an unfavorable prognosis. Wound healing analyses were performed to investigate the impact of KIFC1 on the migratory capacities of glioma cells. In contrast to glioma cells with normal KIFC1 expression, the findings from both assays demonstrated a substantial inhibition of migratory capabilities in KIFC1 knockdown cells (Fig. 4A and B). MMPs, a group of extracellular proteases, have been implicated in the degradation of various extracellular matrix (ECM) constituents, thereby implicating their involvement in tumor migration and invasion, including glioma [6,28,33]. The impact of KIFC1 knockdown on the expression levels of MMP2, a crucial member of the MMP family, was assessed by gelatin zymography assay, revealing a downregulation of MMP2 expression upon KIFC1 knockdown (Fig. 4C and D). Transwell invasion assays investigated the impact of KIFC1 on the invasive capabilities of glioma cells and compared the invasive capacity of glioma cells with and without KIFC1. The findings demonstrated that the invasive capacities of glioma cells with KIFC1 knockdown were notably suppressed (Fig. 4E and F).
DISCUSSION
Despite the significant developments in therapeutic interventions for glioma over the recent decades, glioma is recognized as a highly lethal form of primary intracranial tumor. Its 5-year survival rate remains staggeringly low, standing at ≤5% [5,8]. The observed low survival rates could potentially be attributed to the proliferative capacity within the cerebral tissue and the aggressive characteristics, thereby presenting significant challenges in therapeutic interventions. KIFC1 upregulation, a crucial factor involved in the clustering of supernumerary centrosomes and the facilitation of cancer cell mitosis, has been documented in many tumors [7,15,17,23,30]. The current understanding regarding the involvement of KIFC1 in glioma remains limited.
The current study elucidated that the KIFC1 expression was found to be higher in both GBM and LGG samples than in normal samples through bioinformatics analysis using the GEPIA platform. Significantly, additional bioinformatics analysis was conducted using the GlioVis data portal, which comprises data from both TCGA and CGGA RNA sequencing databases which revealed a positive correlation between the KIFC1 expression and the grade of the tumor. Similarly, IHC analysis determined the relationship between KIFC1 expression and tumor grade in ovarian carcinoma [19,21]. In addition, the current investigation employed survival analysis to evaluate the prognostic significance of KIFC1 in glioma. The findings demonstrated that patients exhibiting elevated levels of KIFC1 expression experienced a significantly inferior prognosis in comparison to those with lower levels of KIFC1 expression.
Therefore, this study postulated that KIFC1 might play a role in the advancement of glioma. To elucidate this hypothesis, two distinct glioma cell lines were transfected with siRNAs specifically designed to target and suppress the KIFC1 expression. The findings from the in vitro experiments demonstrated that KIFC1 knockdown in glioma cells resulted in the inhibition of cell proliferation, migration, and invasion. These observations align with previous investigations in various cancer types, thereby supporting the consistency of these outcomes across different malignancies [17,21,23,30].
In lung cancer, suppressing KIFC1 expression leads to an upregulation of p21 and a downregulation of cdc2. These findings suggest that the knockdown of KIFC1 effectively inhibits the proliferation of tumor cells [17]. In KIFC1 overexpressed hepatic cancer cells, there was an increase in the expression of mesenchymal markers, vimentin, and Twist1, while the expression of the epithelial marker E-cadherin was downregulated. These alterations in marker expression contribute to the induction of epithelial-mesenchymal transition (EMT), ultimately facilitating cancer invasion and metastasis [27].
Also, KIFC1 upregulation leads to the GSK3β phosphorylation and protein kinase B (AKT) activation, thereby inducing proliferation and triggering EMT in bladder cancer. The investigation highlights that KIFC1 is pivotal in promoting migration, proliferation, and metastasis in bladder cancer via the Akt/GSK3β signaling pathway [30]. KIFC1 overexpression was investigated in endometrial cancer cells. The E-cadherin expression was substantially downregulated, while the expression of N-cadherin and vimentin was noted to be upregulated. These findings provide evidence that KIFC1 promotes the migration, invasion, and EMT of endometrial cancer cells [34].
Centrosome amplification, a prominent feature of cancer, is implicated in the unregulated proliferation of cells. The involvement of KIFC1 in the clustering of supernumerary centrosomes into two functional spindle poles, thereby ensuring the progression of mitosis. This crucial role of KIFC1 has been observed in the proliferation of various types of cancer cells [7,15,24,32]. This investigation has observed that suppressing KIFC1 expression also leads to a notable reduction in the U87MG and U251 cell proliferation. The phenomenon of autophagy, a cellular catabolic process that involves the degradation of cellular components by lysosomes, was initially named and described by Christian de Duve in 1963 [13]. It has been indicated that initiating autophagic cell death could potentially serve as a protective mechanism against impaired apoptosis, thereby facilitating the elimination of glioma cells. Autophagy has been observed to exert dual effects on glioma, either inducing cell death or promoting proliferation, depending on the specific stimuli and signaling pathways engaged in the autophagic cascade. The suppression of autophagy-related 4℃ cysteine peptidase levels resulted in its inhibition and increased apoptosis in T98G glioma cells [29]. Pallichankandy et al. [20], showed that the inhibition of glioma cell proliferation occurs due to the role of autophagic cell death. This process was found to be mediated by the activation of the extracellular regulated protein kinases (ERK) 1/ERK2 pathway, which was dependent on the production of reactive oxygen species. In a study conducted by Shin et al. [25], it was observed that autophagy resulted in the death of glioma cells by suppressing the AKT/mammalian target of rapamycin (mTOR) signaling pathway. In contrast, Bao et al. [1] revealed that the glioma stem cell proliferation was facilitated by inhibiting autophagy via the activation of the mTOR signaling pathway. Simultaneously, the findings obtained from the investigation unveiled that KIFC1 downregulation exhibited dual effects on cellular processes in U251 and U87MG cells. Specifically, it not only restricted cell proliferation but also facilitated the occurrence of autophagy. Further investigations are needed to elucidate the precise mechanisms by which KIFC1 regulates autophagy and proliferation in glioma cells.
Migration and invasion are two prominent characteristics of glioma that significantly contribute to its malignant phenotype. The present study elucidates the significant involvement of KIFC1 overexpression in tumor metastasis across various cancer types, such as lung cancer, ovarian adenocarcinoma, and hepatocellular carcinoma [9,10,21]. Nevertheless, the fundamental mechanisms of KIFC1 in these cancer types have not been previously documented. EMT is characterized by acquiring mesenchymal characteristics by tumor-associated epithelial cells which leads to a reduction in cell-cell contact, potentially facilitating the progression of cancer [7,10,31]. In a recent study conducted by Han et al. [10], it was demonstrated that the KIFC1 overexpression in hepatocellular carcinoma cells resulted in the EMT reduction. This transition was characterized by alterations in cell morphology, transitioning from a round or cobblestone-like appearance (epithelial morphology) to a spindle shape (mesenchymal morphology). Also, the upregulation of mesenchymal markers, including N-cadherin and vimentin, was observed, further supporting the EMT in these cells. Further, MMP2, an important member of the MMP family responsible for the degradation of the ECM, has been identified as a potential indicator of EMT. It has been extensively documented that MMP2 is crucial in advancing various cancer types, including glioma [6,7,28,33]. According to previous findings, the current investigation demonstrated that suppressing KIFC1 expression in glioma cells exerted inhibitory effects on cell migration and invasion. Also, the secretion of MMP2 was downregulated, as evidenced by the outcomes of the gelatin zymography assay. A previous investigation on hepatocellular carcinoma showed that the expression of MMP2 was downregulated after the knockdown of KIFC1 [27]. Further research is necessary to elucidate how KIFC1 modulates cellular migration, invasion, and MMP2 expression.
CONCLUSION
In conclusion, the results demonstrated that KIFC1 expression was increased in glioma, and a positive correlation was observed between its expression and the tumor grade. Bioinformatics analysis investigated the association between KIFC1 expression and prognosis in patients with glioma. The results revealed that patients exhibiting high levels of KIFC1 expression with a significantly poorer prognosis in comparison to those with low levels of KIFC1 expression. This finding suggests that KIFC1 expression may serve as a potential prognostic marker for glioma patients. Moreover, in vitro experiments have revealed that the knockdown of KIFC1 significantly impedes the proliferation, migration, and invasion of glioma cells, it induces autophagy and leads to a downregulation of MMP2 expression. Overall, the findings indicated the prospective prognostic and therapeutic significance of KIFC1 in glioma. However, additional investigation is necessary to elucidate the exact underlying mechanisms of KIFC1 in glioma.