Investigating the Potential of Lipids for Use as Biomarkers for Glioblastoma via an Untargeted Lipidomics Approach
Article information

Abstract
Objective
The types and functions of lipids involved in glioblastoma (GB) are not well known. Lipidomics is a new field that examines cellular lipids on a large scale and novel aplication of lipidomics in the biomedical sciences have emerged. This study aimed to investigate the potential of blood lipids for use as biomarkers for the diagnosis of GB via untargated lipidomic approach. Gaining a deeper understanding of lipid metabolism in patients with GB can contribute to the early diagnosis with GB patiens and also development of novel and better therapeutic options.
Methods
This study was performed using blood samples collected from 14 patients (eight females and six males) and 14 controls (eight females and six males). Lipids were extracted from blood samples and quantified using phosphorus assay. Lipid profiles of between patients with GB and controls were compared via an untargeted lipidomics approach using 6530 Accurate-Mass Q-TOF LC/MS mass spectrometer.
Results
According to the results obtained using the untargeted lipidomics approach, differentially regulated lipid species, including fatty acid (FA), glycerolipid (GL), glycerophospholipid (PG), saccharolipid (SL), sphingolipid (SP), and sterol lipid (ST) were identified between in patients with GB and controls.
Conclusion
Differentially regulated lipids were identified in patients with GB, and these lipid species were predicted as potential biomarkers for diagnosis of GB.
INTRODUCTION
Glioblastoma (GB) is the most common and aggressive primary intracranial mass lesion observed in adults. Despite there being multimodal therapies against it, the average survival is approximately 12–14 months [4]. Normal cells primarily rely on mitochondrial oxidative phosphorylation, which typically has a relatively low glycolytic rate, to generate the energy needed for cellular processes. In contrast, energy production in cancer cells is mainly dependent on glycolysis followed by lactic acid fermentation. This phenomenon, termed as the “Warburg effect,” has long been recognized as the critical metabolic difference between cancer and normal cells [3,29].
Rapidly proliferating cells also exhibit alterations in lipid metabolism, and increased lipogenesis is considered another metabolic characteristic of cancer cells. Accordingly, glioma tissues have been shown to have increased lipid synthesis, and nuclear magnetic resonance studies have demonstrated a correlation between the lipid resonance spectrums of GB extracts and the degree of malignancy [11,35]. Cancer cells utilize exogenous fatty acids (FAs) for growth and increased de novo lipid synthesis [19]. Lipids, including FAs, triglycerides (TAGs), and phospholipids (PLs), are the mediators of signal transduction involved in numerous physiological responses. However, the mechanism by which lipids play a role in the development and progression of brain tumors is still unclear. Studies investigating brain tissues of patients with GB have shown that lipid droplets (LDs) that are not observed in normal brain tissues are highly abundant in tumor tissues; however, the types and functions of the lipids involved in GB are not well known [33]. A better understanding of lipid metabolism can contribute to the development of novel treatment modalities for GB. Given the critical role of lipids in cell membrane formation and signal transduction, identifying the key players involved in the reprogramming of lipid metabolism will enable the development of novel therapeutic strategies and possible biomarkers for GB.
Lipidomics is a branch of science that focuses on the types of lipids and biological roles of proteins involved in lipid metabolism and function, including their complete characterization and gene regulation analysis [24]. Exploratory lipidomics can be classified into three types according to the analytical objective : focused lipidomics (lipid profiling), targeted lipidomics (targeted lipid analysis), and untargeted lipidomics (universal lipid profiling) [36,42]. Briefly, lipidomics involves the identification and quantification of lipids in biological systems [9]. Studies have shown that certain diseases (e.g., Alzheimer’s disease, schizophrenia, bipolar disorder, multiple sclerosis, chronic kidney failure, and cystic fibrosis) and cancers (e.g., prostate, insulin growth factor receptor-2 (IGFR-2)- positive metastatic breast, and colorectal cancers) are closely related to changes in lipid ratio and that some lipid molecules are associated with the development of certain diseases [1,8,10,13,17,22,24,25,28,30,34,37,39,41,43,44]. The outcomes of the studies suggest that alterations in the lipid profiles of different lipid types specific to different diseases can be used as biomarkers for that disease.
In our study, lipids isolated from blood samples obtained from patients with GB were investigated for the first time using an untargeted lipidomics approach to evaluate the potential of lipid species that vary between healthy individuals and patients with GB for use as biomarkers.
MATERIALS AND METHODS
This study was approved by University Ethics Committee of Sivas Cumhuriyet University (approval number : 2020-06/02, date of approval : November 6, 2020). The patients who presented to the brain and neurosurgery clinic with a preliminary diagnosis of an intracranial mass and were diagnosed with GB (World Health Organization grade IV) via pathological examination were included in this study. A control group comprising age- and sex-matched healthy individuals who did not have any chronic diseases and did not use any medications were included. Blood samples were collected from patients and controls (Table 1).
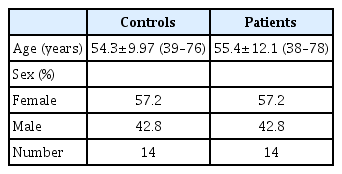
Demographic characteristics of patients with glioblastoma and controls
Sample collection
Of the 1-mL blood sample, 500 µL was immediately mixed with 1 mL of methanol:water (1.0 : 0.4 volume/volume [v/v]) and then placed stored at -80°C until lipid extraction was performed as described below.
Bligh and Dyer method of blood lipid extraction
Lipids were extracted using chloroform and methanol according to the Bligh and Dyer method [6]. Briefly, blood samples suspended in 1.25 mL of methanol and 1.25 mL of chloroform were subjected to lipidomics analysis. Tubes were vortexed for 30 seconds, allowed to sit for 10 minutes on ice, and centrifuged (213×g; 5 mintues), and the bottom chloroform layer was transferred to a new test tube. The extraction steps were repeated for a second time, and the obtained chloroform layers were combined. The chloroform layers were dried under nitrogen, reconstituted with 50 µL of methanol : chloroform (3 : 1 v/v), and stored at -80°C until further analysis.
Lipid phosphorus assay
Lipid phosphorus was quantified using the phosphorus assay2). First, 400 µL of sulphuric acid (5 M) was added to the extracted lipids (10 µL), and the solution was heated in a glass test tube at 180–200°C for 1 hour. Next, 100 µL of 30% H2O2 was added to the tube while vortexing, and the tube was heated at 180–200°C for 1.5 hours. A reagent (4.6 mL; 1.1 g ammonium molybdate tetrahydrate + 12.5 mL sulphuric acid + 500 mL double distilled water) was added and vortexed, followed by the addition of 100 µL of 15% ascorbic acid and vortexing. The solution was heated for 7–10 minutes at 100°C, and a 150-µL aliquot was used to measure the absorbance at 830 nm.
Quadrupole time-of-flight liquid mass spectrometer (Q-TOF LC/MS) : electrospray ionisation mass spectrometry (ESI-MS)-based lipid analysis
Lipid extract samples (500 pmol/µL) were prepared by reconstitution in chloroform:methanol (2 : 1, v/v). ESI-MS was performed as described previously [18,26,39] using an Agilent Technologies 6530 Accurate-Mass Q-TOF LC/MS mass spectrometer (Agilent Technologies, Santa Clara, CA, USA) with a dry nitrogen gas flow rate of 8 L/min at 350°C and a nebulizer pressure of 30 psi. The scanning range was from 200 to 1000 mass/charge (m/z) ratio for 5 µL of the sample scanned in positive and negative ion mode for 2.5 minutes with a mobile phase of acetonitrile : methanol : water (2 : 3 : 1) in 0.1% ammonium formate. As described previously [32], qualitative identification of individual PL molecular species was based on their calculated theoretical monoisotopic mass values, subsequent MS/MS analysis, and their level normalized to either the total ion count or the most abundant PL. Fragmentation was performed using an Agilent Technologies 6530 Accurate-Mass Q-TOF LC/MS mass spectrometer equipped with an ESI source. The direct injection feature of the HPLC system (Agilent Technologies) was used to introduce the analyte. The dry nitrogen gas flow rate was 8.0 L/min at 350°C. ESI-MS analysis spectrums in positive and negative ion modes were obtained using Agilent Technologies 6530 Accurate-Mass Q-TOF LC/MS mass spectrometer. A tentative ID was assigned based on the m/z ratio and the LIPID MAPS database [20].
Statistical analysis
Multivariate principal component analysis (PCA) was performed using MetaboAnalyst 5.0 (https://www.metaboanalyst.ca) [21]. Automatic peak detection and spectrum deconvolution was performed using a peak width set at 0.5. Data were normalized to the sum, and scaled to the Z-value. Analysis parameters consisted of interquartile range filtering and sum normalization without the removal of outliers from the dataset. Features were selected based on volcano plot analysis and were further identified using MS/MS analysis. Significance for the volcano plot analysis was determined based on a fold change threshold of 2.00 and p≤0.05. Following identification, the total ion count was used to normalize each parent lipid level, and the change in the relative abundance of that lipid species as compared to its control was determined. This is the standard method for lipidomics analysis as reported in previous studies [18,26].
RESULTS
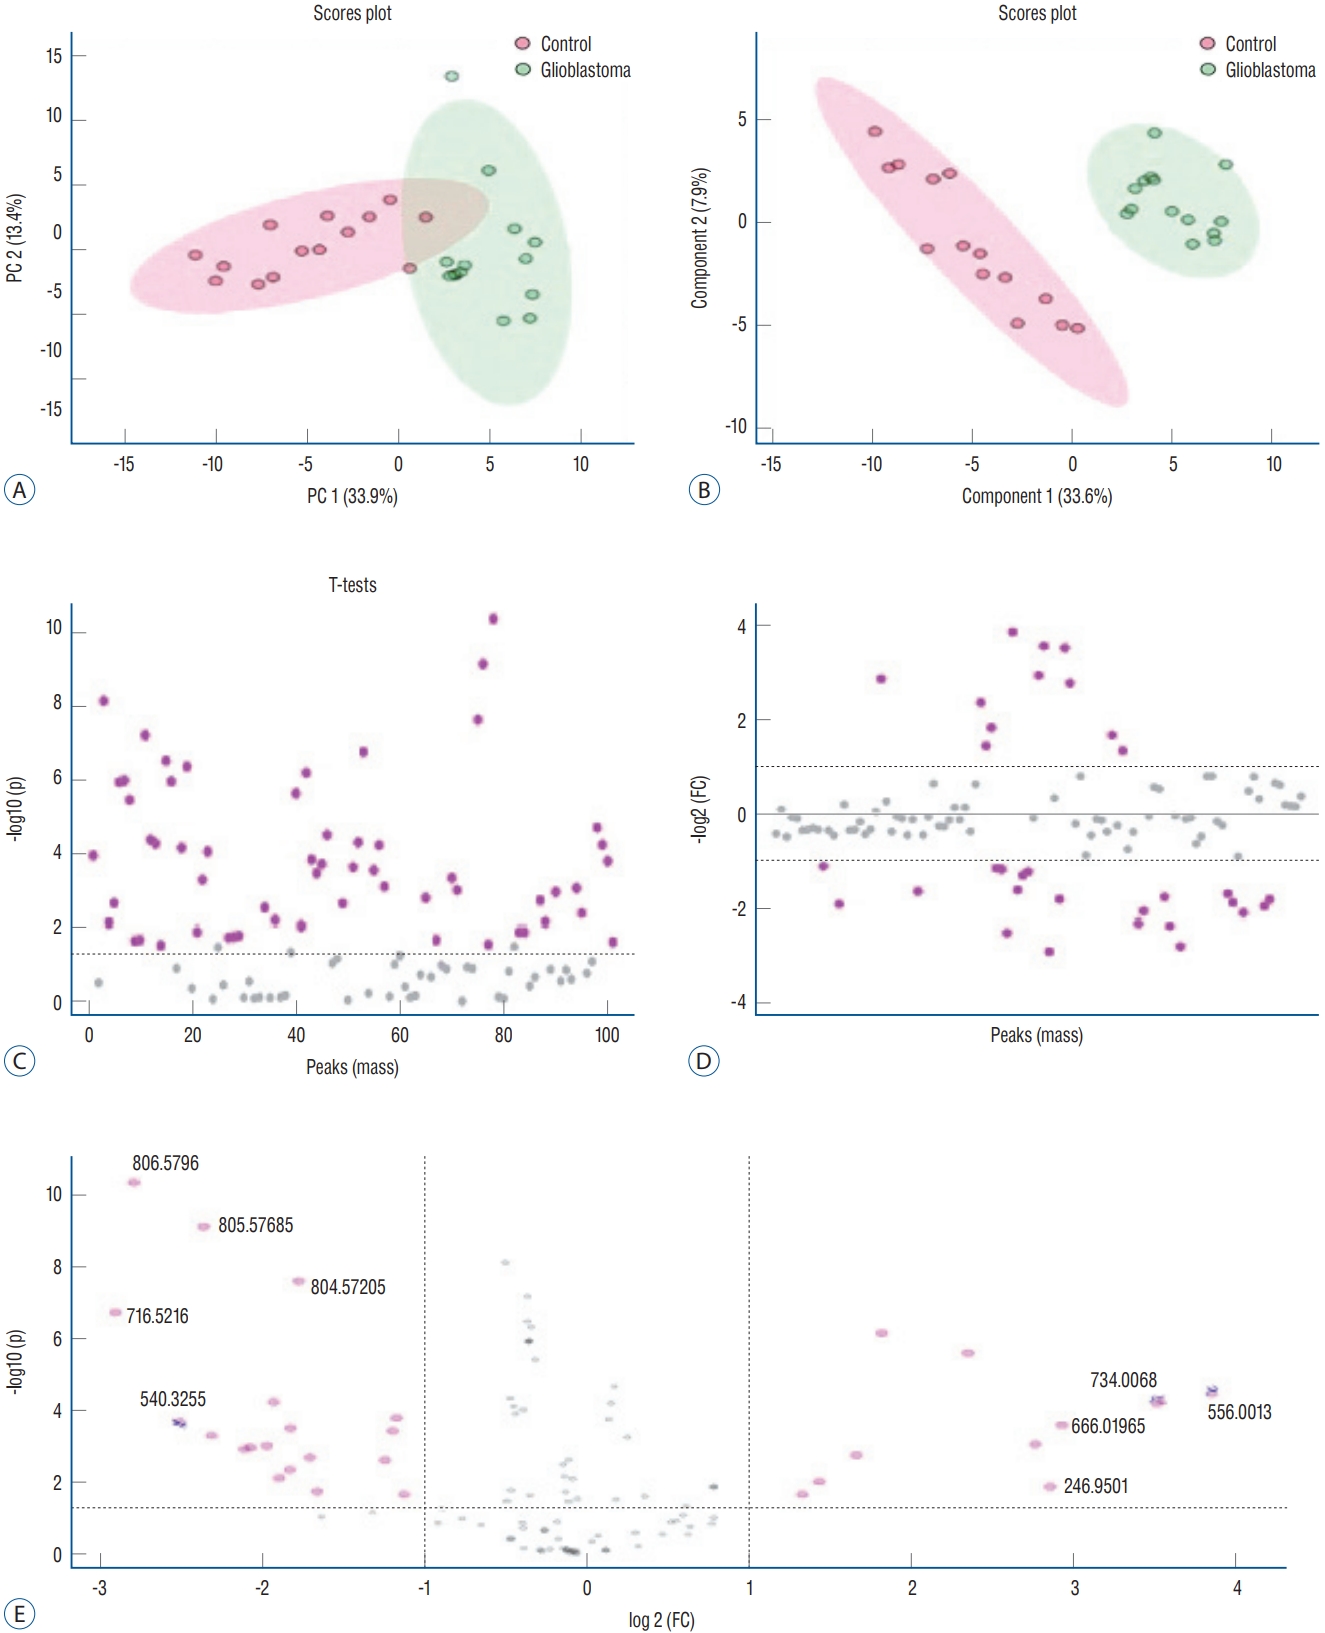
The data obtained from ESI-MS analysis were analyzed using the parameters presented in the Materials and Methods section via MetaboAnalyst 5.0 and Lipid Maps databases. Figs. 1A and B, 2A (for positive ion mode) and Figs. 3A and B, 4A (for negative ion mode) represented that the whether there was a difference between the GB and control groups via multivariate analyses, such as PCA, partial least squares discriminant analysis (2D-PLS-DA), and OrthoPLSDA analysis. PCA is the most used explorative multivariate method. PCA is generally preferred for purposes of data reduction. The primary goal of PCA is to explain the variation in the original data using a reduced space, defined by variables called principal components (PC1 and PC2), which retain most of the relevant information from the original data. The ideal situation occurs when control and treated samples appear far enough to be completely distinguished. The 2D-PLS-DA analysis of the targeted acquired data (Figs. 1B and 3B) resulted in better model separation compared to the PCA model (Figs. 1A and 3A) created from the blood samples. The score plots of the 2D-PLS-DA from untargeted lipidomics were clearly clustered between GB patients (green) and control (red) groups. Further, t-test was performed (Fig. 1C for positive ion mode; Fig. 3C for negative ion mode). Assuming a fold change threshold of 2.0 and a pvalue of 0.05, lipid types (detected by t-test) that differed between the two groups were identified using this changing ratio (fold change; Fig. 1D for positive ion mode; Fig. 3D for negative ion mode). Volcano plot, which numerically gives the m/z ratios of lipid types varying between groups, was obtained by combining the t-test and the logarithm of the fold change graphs (Fig. 1E for positive ion mode; Fig. 3E for negative ion mode). The m/z ratios obtained from the volcano plot were interpreted using the Lipid Maps database, and the classes of lipid types corresponding to these m/z ratios were determined using MS-MS validation (Tables 2 and 3). Orthogonal projections to latent structures (OPLS) has a similar predictive capacity compared to PLS and improves the interpretation of the predictive components and of the systematic variation (Figs. 2A and 4A) [27]. In particular, OPLS modeling of single responses only requires one predictive component.

Principal component analysis (2d-PcA; A), partial least squares discriminant analysis (2d-PLS-dA; b), t-test (c), fold change (Fc) (d), and volcano (Vc) (e) plots of patients with glioblastoma and controls in positive ion mode.
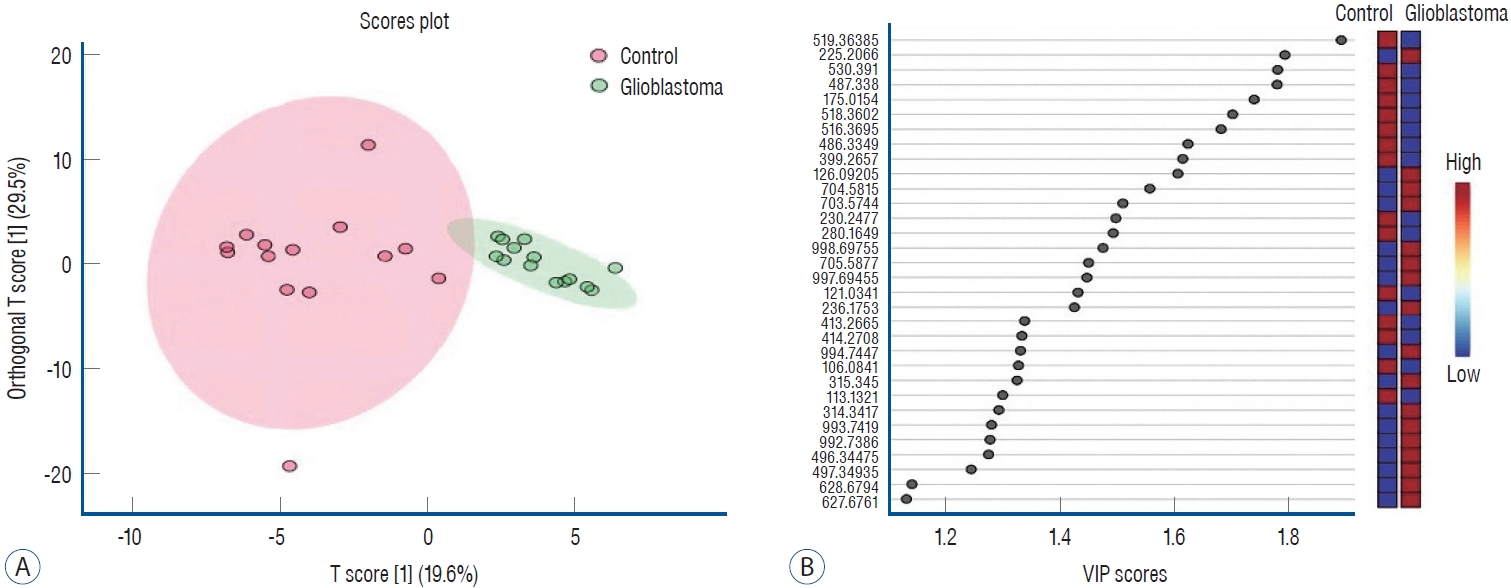
Orthogonal projections to latent structures discriminant analysis (OrthoPLSdA) diagram (A) and Orthogonal projections to latent structures discriminant analysis-variable importance projection (OrthoPLSdA-VIP) score (b) plot for lipid types different between patients with glioblastoma and controls (positive ion mode).
Principal component analysis (2d-PcA; A), partial least squares discriminant analysis (2d-PLS-dA; b), t-test (c), fold change (Fc) (d), and volcano (Vc) (e) plots of patients with glioblastoma and controls in negative ion mode.

Orthogonal projections to latent structures discriminant analysis (OrthoPLSdA) diagram (A) and Orthogonal projections to latent structures discriminant analysis-variable importance projection (OrthoPLSdA-VIP) score (b) plot for lipid types different between patients with glioblastoma and controls (negative ion mode).

Lipid types and classes different between patients with glioblastoma and controls (positive ion mode; p<0.05)

Lipid types and classes different between patients with glioblastoma and controls (negative ion mode; p<0.05)
Table 2 presents the corresponding lipid classes in the Lipid Maps database of 32 significantly altered (p<0.05) m/z ratios obtained from the volcano plot data. Fig. 2B shows the variable importance projection (VIP) scores of the lipid types that were significantly different (p<0.05) between patients with GB and controls, with m/z ratios obtained from the volcano plot on the Y-axis. The levels of 17 and 15 lipid types were found to be higher (shown in red) and lower (shown in blue), respectively, in patients with GB than in controls. Table 3 presents the corresponding lipid classes in the Lipid Maps database of 30 significantly altered (p<0.05) m/z ratios obtained from the volcano plot data. Fig. 4B shows the VIP scores of the lipid species found to be different between patients with GB and controls, with m/z ratios obtained from the volcano plot on the Y-axis. The levels of 20 and 10 lipid types were found to be higher (shown in red) and lower (shown in blue), respectively, in patients with GB than in controls. These lipid types with increased and decreased levels due to GB are predicted as lipid biomarkers for GB.
DISCUSSION
GB is the most common and rapidly progressing malignant form of primary brain tumors of the central nervous system. It is characterized by a poor prognosis [31]. It is highly invasive, and despite the current treatment options, improved survival rates have not been reported over the past two decades. Biomarkers can be considered as diagnostic, prognostic, or therapeutic indicators of a disease. New approaches and technologies based on system biology have the potential to identify biomarkers that can be used as new therapeutic targets for GB. Identification of cancer-specific biomarkers and detection of tumors from easily accessible samples, such as bodily fluids (e.g., blood, urine, or saliva), will be a significant advance in the field of neuro-oncology [14,16]. There is an immense need to advance the use of biomarkers in the field of neuro-oncology as current imaging systems often fail to provide adequate information about relapsing tumor growth or the actual biological status of either the primary or recurrent tumor. This lack of knowledge leads to a fairly uniform treatment regimen for every patient, precluding an individualized approach for the management of the disease and the assessment of individual responses to treatment.
Lipids stored in tumor cells are thought to play a number of critical roles during nutritional stress, including energy production, membrane biogenesis, cellular signaling, and nutrient transport [38]. In addition to other functions, lipids essentially act as structural components of cellular membranes. Lipids can be detected in brain tissues due to cell membrane destruction and necrosis of malignant brain tumors, such as GB. Lipidomics analyses revealed the accumulation of five major lipid classes in GB, predominantly ceramides, total polar lipids (TPLs), diacylglycerol (DAGs), TAGs, and sphingomyelins (SMs). In previous studies, higher amounts of different types of PLs were observed in the serum of patients with various primary brain tumors. Similarly, under lipid-restricted growth conditions, cancer cells have been reported to exhibit an increased dependence on de novo FA synthesis to maintain their growth and survival. In a study by Taïb et al. [33], multiple changes in the lipidomics profiles of cells primarily including PLs, DAGs, and TAGs were demonstrated in response to the absence of serum lipids. Accordingly, they proposed that alterations in lipid types may indicate putative metabolic pathways that mediate cell growth in GB. Additionally, they reported that GB cells alter their lipid composition as an adaptation mechanism in response to exogenous monounsaturated long chain FAs (e.g., oleic acid) through increased TAG accumulation and FA esterification and oxidation. Oleic acid also stimulates GB proliferation through a mechanism involving monoacylglycerol lipase [33]. Examination of brain tissues collected from patients with GB shows that LDs are abundant in tumor tissues but are not found in normal brain tissues [33]. Taïb et al. [33] treated U138 GB cells with oleic acid to investigate how FAs are utilized by GB cells and assess their role in GB proliferation. This treatment induces the accumulation of perilipin-2-coated LDs containing TAGs enriched in C18 : 1 FAs and an increase in FA oxidation. Interestingly, oleic acid also increased glucose utilization and proliferation of GB cells. In contrast, the pharmacological inhibition of monoacylglycerol lipase reduced GB proliferation. Hence, it was suggested that monounsaturated FAs increase GB proliferation through triglyceride metabolism, indicating a novel LD-mediated pathway that may be a therapeutic target for GB. Hu et al. [15] orally administered carbon-13 (13C) FAs to mice using a gastric probe and reported a significant 13C increase in gliomas and a minor 13C increase in capillary endothelial cells of the normal brain tissue. These results were supported by a previous study showing the disruption of the blood-brain barrier in an experimental brain metastases model [40]. Moreover, lipids containing FAs, TAGS, and PLs have been implicated as mediators of signal transduction involved in several physiological reactions [23]. Circulating lipid types have not been extensively studied as putative biomarkers in patients with GB; however, 24S-hydroxycholesterol is among the brain-specific lipids identified in the systemic blood circulation [5]. However, elevated serum levels of 24S-hydroxycholesterol are only observed following severe central nervous system trauma and not in response to brain tumors [7].
In general, GB xenograft tumor tissues have been observed to have significantly lower lipid levels compared with normal brain tissues. These results suggest that GB cells can oxidize FA as an additional energy source in a nutrient-free cancer environment. Normal brain tissues have extensive cellular insulation containing lipid-rich myelin. The replacement of normal neuronal cells by tumor cells is accompanied by a reduction in lipid-rich myelin, followed by a reduction in the overall lipid profile of the tumor. Ha et al. [12] investigated lipid biomarkers in ectopic and orthotopic human GB xenograft models. Proteins, metabolites, and lipids were isolated from the collected tumor tissues following the injection of primary patient cell lines, GBM10 and GBM43, into the lateral and right cerebral hemispheres of nonobese diabetic/severe combined immunodeficiency (NOD/SCID) mice. Lipid analysis was performed via reversed-phase high-performance liquid chromatography coupled with Fourier transform ion cyclotron resonance MS. More than 500 lipids were identified in each tumor model, and a comparison of ectopic and orthotopic tumor models revealed that the most prominent changes in lipid types predominantly occurred in four major lipid classes―glycosphingolipids, glycerophosphoethanolamines, triacylglycerols, and glycerophosphoserines [12].
CONCLUSION
In our study, all lipid profiles of patients with GB and controls were compared using the untargeted lipidomics approach. Lipid types that differed significantly between patients with GB and controls were determined via screening using both positive and negative ion detection modes. The results obtained using the untargeted lipidomics approach predicted sxt-two m/z ratios which corresponding different lipid types with significantly increased/decreased levels (p<0.05) in patients with GB and controls as possible biomarkers for GB. With the application of the untargeted lipidomics approach, specific lipid classes can distinguished and the m/z ratios of the lipid types corresponding to more than one lipid class (Tables 2 and 3) can be determined, which can help predict more lipid types as biomarkers. In conclusion, lipid classes such as FA, glycerophospholipid, and glycerolipid displayed the most significant changes in patients with GB; however, the changes were also detected in a small number of lipid types among sphingolipid and sterol lipid classes. We propose that these lipid types can be used as possible biomarkers for GB diagnosis and also development different treatment stratecies.
Notes
Conflicts of interest
No potential conflict of interest relevant to this article was reported.
Informed consent
Informed consent was obtained from all individual participants included in this study.
Author contributions
Conceptualization : BS, SŞB; Data curation : BS, ZB, SŞB; Formal analysis : SŞB; Funding acquisition : BS, ZB, SŞB; Methodology : BS, ZB, SŞB; Project administration : BS, ZB, SŞB; Visualization : BS, SŞB; Writing - original draft : BS, SŞB; Writing - review & editing : BS, ZB, SŞB
Data sharing
None
Preprint
None