Automatically Diagnosing Skull Fractures Using an Object Detection Method and Deep Learning Algorithm in Plain Radiography Images
Article information

Abstract
Objective
Deep learning is a machine learning approach based on artificial neural network training, and object detection algorithm using deep learning is used as the most powerful tool in image analysis. We analyzed and evaluated the diagnostic performance of a deep learning algorithm to identify skull fractures in plain radiographic images and investigated its clinical applicability.
Methods
A total of 2026 plain radiographic images of the skull (fracture, 991; normal, 1035) were obtained from 741 patients. The RetinaNet architecture was used as a deep learning model. Precision, recall, and average precision were measured to evaluate the deep learning algorithm’s diagnostic performance.
Results
In ResNet-152, the average precision for intersection over union (IOU) 0.1, 0.3, and 0.5, were 0.7240, 0.6698, and 0.3687, respectively. When the intersection over union (IOU) and confidence threshold were 0.1, the precision was 0.7292, and the recall was 0.7650. When the IOU threshold was 0.1, and the confidence threshold was 0.6, the true and false rates were 82.9% and 17.1%, respectively. There were significant differences in the true/false and false-positive/false-negative ratios between the anterior-posterior, towne, and both lateral views (p=0.032 and p=0.003). Objects detected in false positives had vascular grooves and suture lines. In false negatives, the detection performance of the diastatic fractures, fractures crossing the suture line, and fractures around the vascular grooves and orbit was poor.
Conclusion
The object detection algorithm applied with deep learning is expected to be a valuable tool in diagnosing skull fractures.
INTRODUCTION
Although it is difficult to accurately determine the frequency of skull fractures in patients with head trauma, it has been reported to be between 6.2–8.6%. A skull fracture caused by a significant impact on the head can affect the patient’s prognosis because it can cause intracranial hematoma and infection [19]. Plain radiography is the simplest and most basic test for diagnosing skull fractures. Essential plain radiography of the skull consists of an anterior-posterior (A-P) view, left and right lateral view, and towne view, while others include the basal view, Waters view, Caldwell view, etc. [13]. Although brain computed tomography (CT) shows the highest accuracy in diagnosing skull fractures [10], it is not cost-effective to perform brain CT on all patients with minor head trauma. Although plain radiography is less accurate than brain CT in evaluating head trauma, it is useful as a skull survey tool in environments where it is difficult to perform brain CT or nonaccidental trauma [1,3,21].
Deep learning (DL) is a machine learning approach based on training artificial neural networks. Recently, it has shown great promise in achieving human or near-human level performance in various overly complex perceptual tasks traditionally challenging for machines to perform, including image classification and natural language processing. Convolutional neural networks (CNN), the standard in computer vision, use filters in each layer to generate many complex features from an input image [8,15].
Currently, image analysis using DL is actively performed in the medical field. In particular, studies for evaluating abnormalities using DL algorithms in imaging examinations have been published [2,4,8,9,15]. There have been several reports of analysis studies using brain CT images for skull fractures; however, no studies have analyzed plain radiographic images to the best of our knowledge. This could be because the skull’s complex structures make it difficult to find a fracture line compared to fractures in other areas such as the arms or legs. Here, we analyze and evaluate the diagnostic performance of the CNN DL algorithm for finding skull fractures in plain radiographic images of the skull and investigate its clinical applicability.
MATERIALS AND METHODS
This retrospective study was approved by the Clinical Research Ethics Review Committee of Gachon University Gil Medical Center (GCIRB2019-411). As this was a retrospective study, the Clinical Research Ethics Review Committee waived the need for informed consent. All methods were carried out under relevant guidelines and regulations of the Declaration of Helsinki.
Development environment
ImageJ ver. 1.52 (National Institutes of Health, Bethesda, MD, USA) software was used to collect annotation data. The system for DL training consisted of four GeForce RTX 2080Ti (NVIDIA, Santa Clara, CA, USA) graphics processing units, Xeon Gold 6238 (Intel, Santa Clara, CA, USA) central processing unit, and 320 GB of random access memory. DL training was performed using Python 3.7.9 and Keras 2.3.1 (including TensorFlow backend) frameworks on Ubuntu 16.04 operating system, and OpenCV 4.4.0 (Intel) library was used for image processing for data.
Data
Among patients classified as having a fracture of the skull vault (code : S020) and a fracture of the skull base (code : S021) according to the 7th Korean Standard Classification of Disease from January 2015 to December 2018, 565 patients with radiologist’s readings of skull fracture on plain radiographs were selected regardless of the fracture type. Also, plain radiographic images were analyzed by two neurosurgeons with more than 10 years’ experience because there were cases where fracture findings were recorded in plain radiographic reading by referring to brain CT results in radiology reading. Sixty-two patients for whom a fracture on plain radiographs could not be found were excluded, and 22 patients who had previous head surgeries or severely comminuted fractures and depression fractures were excluded. The remaining 481 patients were included here. Finally, a further 260 patients with head injuries but no skull fractures were included to train the DL algorithm; thus, 741 patients were included here. A total of 2026 images (fracture, 991; normal, 1035) were obtained from the 741 patients (Fig. 1). Among them, 1639 images (fracture, 810; normal, 829) were used for DL algorithm training, and the remaining 387 images were used for DL algorithm testing. The mean age of all the patients (319 women and 412 men) was 42±26 years.

Patient selection.
Two neurosurgeons with more than 10 years’ experience drew a box-shaped region of interest (ROI) in the area where the fracture was found, and the X and Y coordinates of the box were used as the ground truth for training and validation.
Preprocessing
In the plain radiographic image data used here, each pixel had a value of 12 bits (0 to 4095). For DL training, the data converted into an 8-bit image (0 to 255) was used by adjusting the 12-bit value of each pixel to a specific window width/level value. When the 12-bit value was converted to 8-bit, pixel loss occurred; and when the 12-bit original data were used, a DL model was trained based on more information. However, because the range of pixel values of the fracture site, which was this study’s main subject, occupied a small part within the range of pixel values of the entire image, narrowing the range of pixel values of the entire image by 8-bit conversion and expanding the range of pixel values of the fracture site was helpful for training. Accordingly, here, the range between the minimum and the maximum pixel values of the 12-bit original data was set to the window width, and the median value between the minimum pixel value and the maximum pixel value was set to a window height; thereby, converting a 12-bit image into an eight-bit image. The converted data were used as the training data.
DL
Here, the RetinaNet architecture was used to train the DL model. The ResNet architecture was applied as a backbone structure to extract the features. RetinaNet had a DL structure for a single-step detection method that applied focal loss. RetinaNet easily detected objects of various sizes by constructing a feature pyramid network on the ResNet network to detect objects of different sizes at each pyramid level [11]. The optimal hyperparameters were searched using a grid search, and the final skull fracture detection model was created using the optimal hyperparameters searched. The optimal hyperparameters used were focal function, Adam optimizer, four batch sizes, 500 epochs, and a learning rate of 0.00001 (Fig. 2).
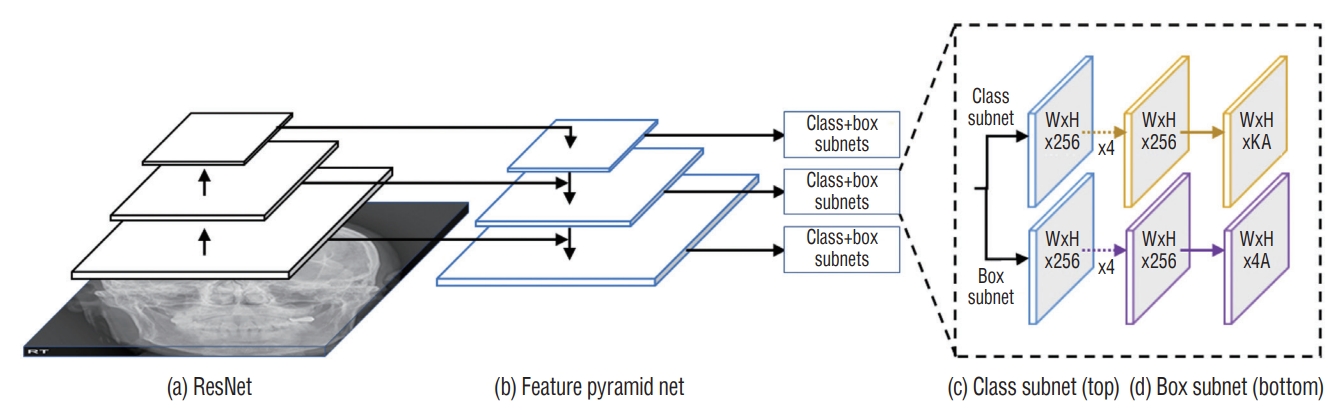
RetinaNet architecture with (a) ResNet and (b) feature pyramid network as a feature extractor to (c) classify the probability of the skull fracture and (d) regress the bounding box coordinates.
Diagnostic performance evaluation and statistical analysis
We statistically analyzed precision, recall, and average precision (AP) using true-positive, true-negative, false-positive, and false-negative values to evaluate the diagnostic performance of DL algorithms for skull fractures. Precision was calculated as true positive / (true positive + false positive), and recall was calculated as true positive / (true positive + false negative). AP was calculated as the area below the precisionrecall curve and used as a performance evaluation index for object detection algorithms [5,12].
Intersection over union (IOU) was a value used to measure the overlap between the predicted and the actual bounding boxes for an object in object detection. As the predicted bounding box value approached the actual bounding box value, the intersection area and IOU value increased [16]. The confidence score was the predicted value of the predicted bounding box. Here, low IOU threshold values such as 0.1 and 0.3 were applied to the performance evaluation to obtain high sensitivity by focusing on screening for a skull fracture, which was the purpose of plain skull radiography.
Pearson chi-square and Fisher exact tests were used to compare true/false and false-positive/false-negative results between plain radiographs and true/false results between adults and children. Statistical significance was set at p<0.05 and was analyzed using SPSS (version 23.0; IBM Corp., Armonk, NY, USA).
RESULTS
To evaluate the performance of the DL algorithm, 387 images were assessed. Three models, ResNet-50, 101, and 152, were used to configure the backbone. AP for IOU 0.1, 0.3, and 0.5 were obtained to compare the models’ performance. ResNet-152 had the highest AP, followed by ResNet-101 and 50 (Table 1). In ResNet-152, the precision and recall values in the confidence score threshold from 0.1 to 0.9 were obtained for IOU thresholds 0.1, 0.3, and 0.5. It was confirmed that the higher the confidence score threshold, the higher the precision and the lower the recall (Table 2). A precision-recall curve was created to evaluate the performance according to IOU, and AP for IOU 0.1, 0.3, and 0.5 (AP10, AP30, AP50) was obtained. AP10, AP30, and AP50 of ResNet-152 were 0.7240, 0.6698, and 0.3687, respectively, confirming that AP decreased significantly when the IOU threshold was 0.5 (Table 1 and Fig. 3).
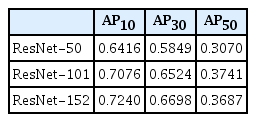
Average precision for IOU threshold 0.1, 0.3, 0.5
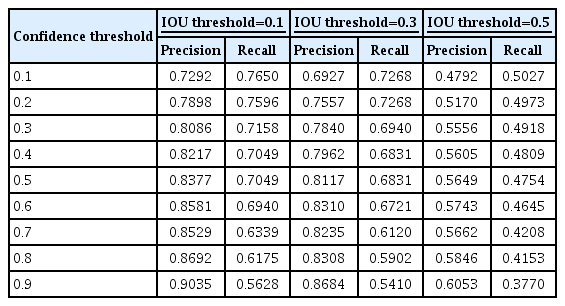
Precision and recall values
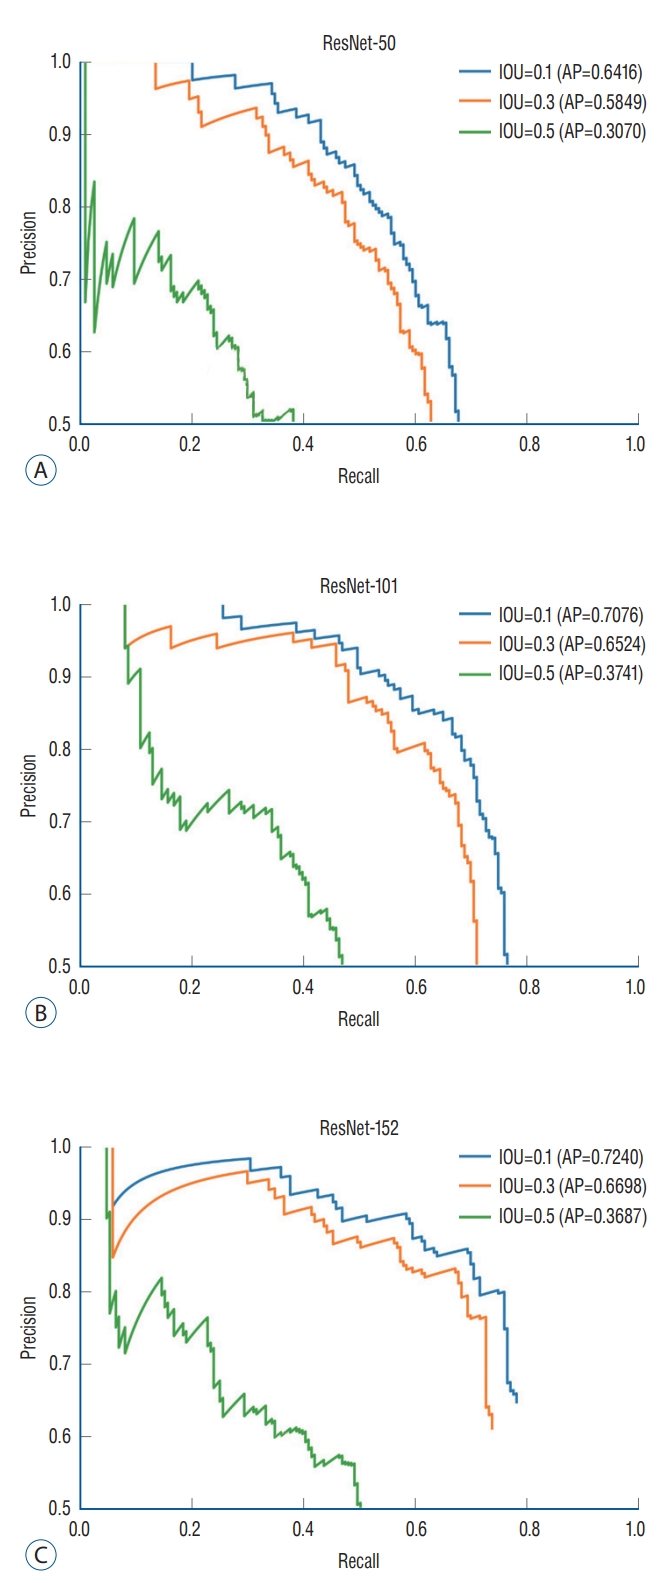
Precision-recall curve. The diagnostic performance of object detection using RetinaNet was assessed by the precision-recall curve and the average precision (AP). AP is calculated as the area under the precision-recall curve. AP values for ResNet models and intersection over union (IOU) thresholds were analyzed.
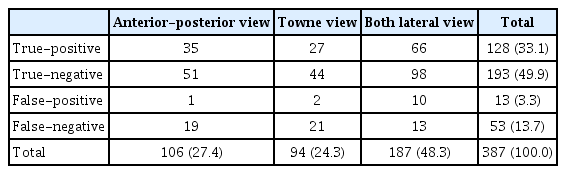
The plain skull radiograph consisted of four types : A-P view, left and right lateral view, towne view, and the detection performance of each view were compared. Because left/right lateral images with left and right reversal had the same characteristics in image analysis, they were combined and analyzed in both lateral views. Based on the IOU threshold of 0.1 and the confidence score threshold of 0.6, 106 images were analyzed in the A-P view, 94 images in the towne view, and 187 images in both lateral views, for a total of 387 images. True positive, true negative, false positive, and false negative for the entire image were 33.1%, 49.9%, 3.3%, and 13.7%, respectively (Table 3 and Fig. 4).
True-positive/negative and false-positive/negative results for each view (IOU threshold : 0.1, confidence threshold : 0.6)
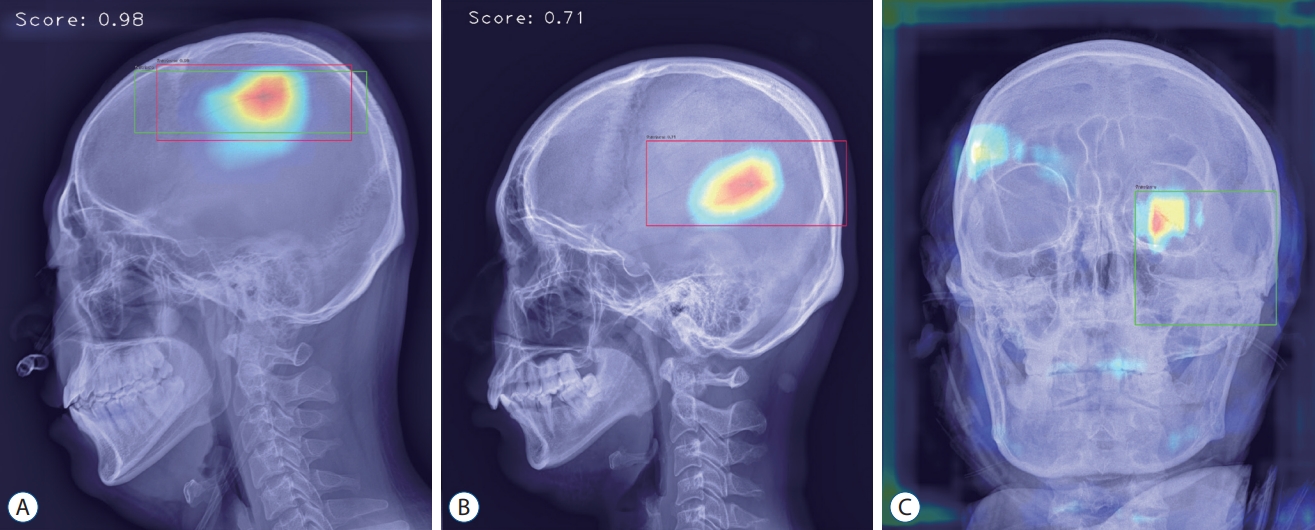
Analyzed sample images. A : True-positive image detecting parietal bone fracture in lateral view. B : False-positive image detecting vascular groove in lateral view. C : False-negative image not detecting diastatic fracture of left lambdoid suture observed in the left orbit area of anterior-posterior view.
The rates of true and false for the entire image were 82.9% and 17.1%, respectively, and there was a statistically significant difference in the true and false rates between the three views (p=0.032). True was the highest on both lateral views, and false was highest in the towne view (Table 4).

True and false results for each view (IOU threshold : 0.1, confidence threshold : 0.6)
The rates of false positives and false negatives for the entire image were 19.7% and 80.3%, respectively, and there was a significant difference in the rates of false positives and false negatives between the three views (p=0.003). The A-P and towne views showed comparable results with less than 10% false positives and more than 90% false negatives, but both lateral views were false-positive (43.5%) and false-negative (56.5%) views, showing a difference from the other two views (Table 5).
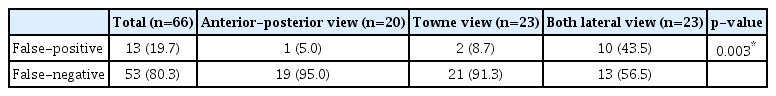
False-positive and false-negative results for each view (IOU threshold : 0.1, confidence threshold : 0.6)
The causes of false positives and false negatives were analyzed. Objects detected as false positives were vascular grooves and suture lines 8 and 5, respectively. Only suture lines were detected in A-P and towne views, and vascular grooves were detected more frequently than suture lines in both lateral views (Table 6). In false-negative cases, an apparent fracture, the most common case, was not detected in 40% of cases, and three characteristic ROI marking areas where fractures were not detected well were identified : vascular groove, suture line, and orbit. Fractures extending across the suture line and diastatic fractures were not found in 32% of false-negative cases, thin fracture lines around the vascular groove in 15%, and fracture lines around the orbit in 13% (Table 7).
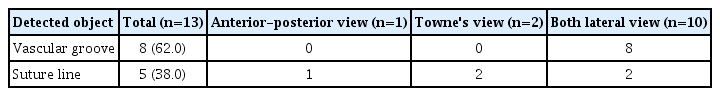
Detected objects in false-positive results
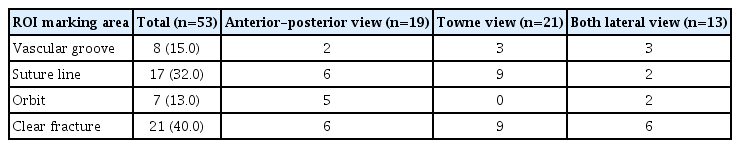
ROI marking areas in false-negative results
Skull images of children under the age of 10 years were analyzed. In 387 images, there were 299 images for adults and 88 images for children. There was no difference in the true-positive/true-negative ratio between adults and children. However, there was a significant difference in the false-positive/false-negative ratio between adults and children (p=0.042). The false-positive/false-negative ratio was 15.5%/84.5% in adults and 50.0%/50.0% in children (Table 8 and Fig. 5).
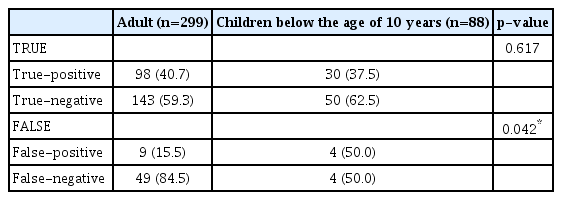
Comparison of true/false results between adults and children
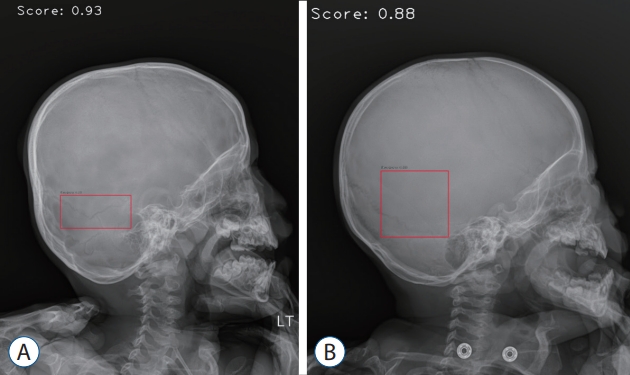
Pediatric sample images. A : False-positive image detecting lambdoid suture and accessory suture. B : False-positive image detecting vascular groove.
DISCUSSION
Recently, DL has been used in various fields (owning to the remarkable development of this technology), such as autonomous driving, artificial intelligence speakers, automatic photo classification services, translators, and weather forecasting. In the medical field, studies using DL were actively conducted. In particular, object detection technology using image analysis has been widely used. The easiest way to apply it was to analyze imaging tests, such as plain radiography and CT, and to detect abnormalities compared to normal ones. Studies to identify fracture sites such as ours were actively conducted, especially in the field of orthopedics.
Krogue et al. [8] carried out a detection study for a pelvic fracture using DL, in which 3034 pelvic plain radiographic images were trained using the DenseNet algorithm. The accuracy for detecting fractures was 93.8%, with a sensitivity of 92.7% and specificity of 95.0%. Chung et al. [4] used DL to detect proximal humerus fractures, and 1891 plain radiographic images were trained using the ResNet-152 algorithm. The results showed an accuracy of 96%, with a sensitivity of 99% and specificity of 97%.
Also, the results showed that the performance of the DL algorithm for detecting fractures in plain radiography was excellent. However, to date, no study has analyzed plain radiographic images of the skull among various body parts. It was thought that this was because, unlike other parts, it was difficult to detect the fracture site because of the skull’s complex structures. Although this study could not be evaluated by comparing the performance of DL algorithms because there has been no research on skull fractures in the past, it was important in that it was the first study to evaluate the performance of a DL algorithm in detecting fractures in plain skull radiographic images.
Here, the performance according to the model and the IOU threshold values was compared. In ResNet-50, 101, and 152 models, the 50, 101, and 152 indicated the number of convolutional layers. There were models with multiple layers, such as 18, 34, 50, 101, 152, and the more layers, the better the performance [6]. Here, the ResNet-152 model with the most layers showed the best results. The IOU was a value indicating the extent to which the predicted bounding box overlapped with the actual part in object detection. Researchers could determine the IOU threshold that recognized an object based on the research purpose. Brain CT was the most accurate test for detecting skull fractures but performing brain CT on all patients with head trauma was not cost-effective. Plain skull radiography had value as a screening test that quickly and simply confirmed abnormalities in patients with head trauma, especially in an environment where brain CT could not be performed. In general object detection research, when the IOU was 0.5, it was set to be recognized as an object, and when it was lower than 0.5, it was set to be recognized as a background [22]. However, it was set to recognize an object at a low IOU value of 0.1 in this study. For example, the IOU was considered low when only a part of the entire fracture site was recognized. Setting such a low IOU threshold value could be significant because partial detection was the basis for suspecting a fracture and conducting a detailed examination. Regarding AP according to IOU, although it did not show satisfactory performance with an AP of 0.3687 at an IOU of 0.5, it showed satisfactory results with an AP of 0.7240 at an IOU of 0.1.
The analysis of false-positive and false-negative results was similar to where people had difficulty judging the skull fracture site. There were two types of false-positive results : vascular grooves and suture lines, which were not fractures. Characteristics that differentiated vascular grooves and suture lines from fracture lines included shade, path, side branches, and width. As a general shading characteristic, the fracture line was dark, the vascular groove showed a sclerotic margin, and the suture line had a perisutural density around the suture line. As a characteristic of the path, the fracture line was straight, the vascular groove was tortuous, and the suture line followed the path of a known suture line. Regarding the characteristics of side branches, the fracture lines usually did not have side branches, the vascular grooves had side branches, and the suture lines met other suture lines. Regarding the width, the fracture line was thin and sharp, the vascular groove was thicker than the fracture line, and the suture line had a serrated shape [17,20]. However, there were many cases where fractures could not be distinguished entirely based on these characteristics. The vascular grooves were all recognized as the fracture lines in the lateral view, and it was thought that vascular grooves for the middle meningeal vessel were the most prominent and were observed from the lateral view. Commonly observed suture lines in plain skull radiographs included coronal, sagittal, and lambdoid suture [7]. Sagittal suture, lambdoid suture in the A-P view, coronal suture in the lateral view, and lambdoid suture in the towne view were easily observed. False positives were thought to be evenly distributed in the A-P, lateral, and towne views because of the characteristics of these views.
There were three types of false-negative cases where a fracture was present but not found, except for cases where the fracture site was clearly visible but not recognized. The first type, the most common, was when the ROI marking included a suture line. There were two kinds of the first type. One was a diastatic fracture with a gap between the suture lines of 2 mm or more. A diastatic fracture was usually diagnosed by comparing the left and right suture lines on a plain radiograph image to confirm the asymmetry and perform a brain CT after suspecting the fracture. In addition, in the case of children under three years of age, the width of the suture line was wide; therefore, this should be considered during diagnosis. In DL, training many images gave reliable results, but here, the images of diastatic fracture were less than those of general linear fracture, so it was thought that sufficient training was not performed. Another kind of the first type was the fracture line extending over the suture line. In this case, the fracture line was recognized as a zigzag-shaped suture line during the detection process. The second type of false negative was that the ROI marking included vascular grooves. In the case of thin fracture lines, it was often difficult to distinguish them from vascular grooves, so it was considered that there were many false positives and false negatives. The third type of false negative was when the ROI marking included the orbit. In particular, there were many such cases in the A-P view. In the A-P view, the shadow of the bone boundary behind the orbit was projected on the inside of the orbit, and the frontal sinus with a different shape for each patient was located above the orbit, showing a complex aspect. Owing to this complexity, it was thought that the DL algorithm had difficulty recognizing fractures by extracting image characteristics during image processing.
Children’s skulls have distinctive characteristics from adult skulls. The primary ossification centers of the frontal, parietal, temporal, and occipital bones appear at 6 weeks of gestation. The skull grows radially from these ossification centers until it reaches the suture site. Skull growth occurs passively according to the brain growth, and the skull takes on the size and shape of an adult skull at the age of 10 to 12 due to the progress of brain growth and ossification. There are two types of sutures in the pediatric skull. The primary suture is commonly seen in adults, and the other is the accessory suture seen in newborns and infants. Accessory sutures include an accessory parietal suture, an intraoccipital suture, a median cerebellar suture, and so on [14,17,18,20]. Here, children under 10 years of age were analyzed, and it was confirmed that the false-positive rate was higher in children than in adults. It was thought that the wide sutures and accessory sutures, which were characteristics of the pediatric skull, made it difficult to detect the fracture line.
Since brain CT has been used as an initial diagnostic tool in patients with a traumatic brain injury recently, the usefulness of plain skull radiograph is much lower than in the past. However, using the DL algorithm in plain skull radiographs is expected to be helpful in situations that cannot use brain CT, such as pregnant patients in the first trimester. In addition, because many hospitals have performed plain skull radiographs rather than brain CT as an initial diagnostic tool for a minor head injury in the emergency room, plain skull radiograph is valuable as a diagnostic tool for traumatic brain injury.
It would be of great clinical use if an algorithm that automatically detected skull fractures using DL was developed. When a doctor other than a neurosurgeon in the emergency room saw a patient with head trauma, the fracture site was sometimes missed on plain skull radiographs. If the program automatically detected the suspected fracture site, it would be of immense help in determining whether a detailed examination was necessary. Also, since the detection result could be checked immediately after taking the image without waiting for the radiologist to read it, it would aid in rapid treatment.
CONCLUSION
This study is the first to show the possibility of detecting skull fractures using DL in plain radiographic images. Since skull fractures caused by head trauma could worsen into serious conditions such as cerebral hemorrhage, a rapid and accurate diagnosis is required.
This study had several limitations. It was a retrospective study, and the number of data required for training was small. In particular, it was necessary to train many images that were expected to be challenging to recognize, such as diastatic fractures. Also, since pediatric skull characteristics differ from adult skull characteristics, more training on pediatric skull images is needed. If training from more data was performed, the detection performance for complex images could be further improved. Another limitation was that there was no performance comparison with professionals. Since this was the first study on skull fractures, we could not compare the performance with other algorithms. Comparing performance with professionals in other ways would have yielded more meaningful results. For example, if the reading results of medical staff by major and training level are compared with the reading results of a DL algorithm, it would help evaluate the performance of the DL algorithm.
The object detection algorithm with DL will be able to improve diagnosis and treatment decisions by aiding the medical staff’s judgments. It is expected that the algorithm’s detection performance could be further improved by additional research in the future.
Notes
Conflicts of interest
Gi Taek Yee has been editorial board of JKNS since May 2017. He was not involved in the review process of this original article. No potential conflict of interest relevant to this article was reported.
Informed consent
This type of study does not require informed consent.
Author contributions
Conceptualization : GTY, KGK; Data curation : TSJ, SGL, WKL; Formal analysis : TSJ, YJK; Funding acquisition : KGK; Methodology : TSJ, GTY, YJK; Project administration : GTY, KGK; Visualization : TSJ, YJK; Writing - original draft : TSJ, YJK; Writing - review & editing : TSJ, GTY, KGK, YJK
Data sharing
None
Preprint
None
Acknowledgements
This work was supported by Institute of Information & Communications Technology Planning & Evaluation (IITP) grant funded by the Korea government (MSIT) (No. 2020-0-00161-001, Active Machine Learning based on Open-set training for Surgical Video) and was supported by the Gachon Gil Medical Center (FRD2019-11-02(3)) and GRRC program of Gyeonggi province (No. GRRC-Gachon2020(B01)).