Clinical Grading System, Surgical Outcomes and Prognostic Analysis of Cranial Base Chordomas
Article information
Abstract
Objective
Cranial base chordomas are rare, but their treatment is challenging. Tumor recurrence is still common despite improvements in microsurgical techniques and postoperative radiotherapy. We retrospectively analyzed the course of treatment, overall survival, and recurrence/progression of chordomas over the past 10 years.
Methods
We retrospectively reviewed 50 patients who underwent surgery at Tianjin Huanhu Hospital between 2010 and 2020 and were pathologically diagnosed with chordomas. Tumor resection was performed within the maximum safe range in all patients; the extent of resection was evaluated by imaging; and the incidence of complications, recurrence or progression, and overall survival were assessed.
Results
Fifty patients were divided into the low-risk group (LRG) and high-risk group (HRG) based on the cranial chordoma grading system (CCGS). The Karnofsky Performance Scale scores and gross total resection rate of the LRG were significantly higher than those of the HRG (p<0.05). The incidence of complications and mortality in the LRG were lower than those of HRG. The analysis of cumulative survival and cumulative recurrence free survival/progression free survival (RFS/PFS) showed no statistical differences in the extent of resection for survival, recurrence, or progression. Univariate and multivariate analyses showed that Ki-67 was significantly associated with tumor recurrence and was an independent hazard factor (p=0.02).
Conclusion
The CCGS can help neurosurgeons anticipate surgical outcomes. Pathological results are important in evaluating the possibility of tumor recurrence, and postoperative radiotherapy improves overall survival and RFS/PFS.
INTRODUCTION
Chordomas are relatively rare malignant tumors that arise from the embryonic remnants of the original notochord, a primitive cell line that can occur anywhere on the central nervous axis and invade the head and neck, mostly developing around the cranial base and spine [22]. Remnants of the notochord are usually located near the midline, embedded in the bone, and considered locally invasive, but they rarely metastasize [17,23]. Cranial base chordomas constitute one-third of all chordomas, usually occur within the vicinity of the clivus, can involve other areas such as the sellar region and sphenoid sinus, and may involve the nasopharynx in a few cases [19]. Patients with tumors large enough to involve the surrounding important neurovascular structures are treated surgically, except a few with incidentally found intracranial masses during physical examination [26]. This increases the difficulty of the surgical procedure and makes complete tumor removal difficult. Previous studies have demonstrated that the extent of tumor resection is associated with recurrence free survival (RFS) [3,7]. The treatment of chordomas is challenging; tumor recurrence after a simple surgical treatment seems inevitable because of the difficulty of gross total resection (GTR). Postoperative radiotherapy is an alternative chordoma treatment worth considering.
In this study, 50 patients pathologically diagnosed between 2010 and 2020 were retrospectively analyzed. Based on the cranial chordoma grading system (CCGS) proposed by Brito da Silva et al. [2], we used the data on the surgical methods, the extent of surgical resection, postoperative radiotherapy, the incidence of complications, histopathological features, life status evaluation using the Karnofsky Performance Scale (KPS) scores, RFS/progression free survival (PFS), and overall survival (OS) to comprehensively and systematically evaluate the outcomes of chordoma patients in Tianjin Huanhu Hospital.
MATERIALS AND METHODS
Patients
This retrospective study was in accordance with the ethical standards and approved by the Institutional Review Board (IRB) of Tianjin Huanhu Hospital (IRB No. 2022-003). We retrospectively reviewed 55 consecutive patients with histopathologically diagnosed chordoma of the cranial base between 2010 and September 2020. The data for all the patients were obtained from the medical records, radiological imaging data, and telephone interviews when necessary. The patients who did not undergo adequate preoperative assessments or postoperative follow-up or those who were diagnosed with chondrosarcomas were excluded. Finally, 50 chordoma patients were included in this study. All patients were assessed based on the KPS score on admission.
Imaging assessment
Preoperative magnetic resonance imaging (MRI) and computed tomography (CT) were performed for all the patients to evaluate the following : 1) the tumor location and size in three dimensions (axial, coronal, and sagittal) – the volume was calculated using the tumor equivalent diameter [20] with the formula, Dmean = (D1 × D2 × D3)1/3; 2) the extent of tumor invasion of surrounding structures, including the relationships between the tumor and the internal carotid artery, vertebral artery, basilar artery, and brainstem; and 3) the extent of bony infiltration. Vascular imaging, such as CT angiography, was also performed to assess the extent of vascular involvement. Postoperative gadolinium-enhanced MRI within 3 days was used to assess any residual tumor. The extents of resection were categorized as follows based on the residual tumor detected on MRI : GTR, if there was no apparent residual tumor; subtotal resection (STR) for minimal residual tumor (tumor removal greater than 90%); and partial resection (PR) for the most residual tumor (removal between 50% and 90% of the tumor).
Surgical treatment and complications
The main purpose of surgical resection is to obtain a definite pathological diagnosis and reduce the mass effect caused by the tumor. If possible, GTR was pursued for all the patients; if the tumor was large or closely related to the important neurovascular structures, it was resected as much as possible to ensure patient safety. If neither was achieved, only PR was performed. The surgical approaches were classified as anterior midline or lateral open cranial base approaches. The former includes extended subfrontal, transsphenoidal, and endoscopic endonasal approaches, while the latter consists of frontotemporal, extended frontotemporal, transcavernous, and extreme lateral transcondylar (or combined infratemporal) approaches. The intraoperative and postoperative complications included death, cerebrospinal fluid leak, cranial nerve palsy, intracranial infection, pituitary dysfunction, diabetes insipidus, epilepsy, and intracranial hemorrhage. All patients were reassessed based on the KPS score on discharge.
Postoperative radiotherapy and follow-up
Not all patients received radiotherapy postoperatively; for those who received it, gamma knife was performed mostly within 1–3 months postoperatively. Radiotherapy was also used as a factor in the assessment of RFS/PFS. The follow-up data included MRI findings usually at 3 and 12 months followed by every 12 months postoperatively, KPS scores at 6 months after discharge, and tumor RFS/PFS. Tumor RFS/PFS was based on tumor recurrence detected by the most recent MRI examination after GTR or the progression of residual disease after STR or PR. OS was defined as the period from the first pathologic diagnosis to the last visit or death.
Statistical analysis
IBM SPSS Statistics ver. 25 (IBM Corp., Armonk, NY, USA) was used for the statistical analysis. The chi-squared test or Fisher’s exact test was used to evaluate the categorical data based on surgical outcomes. The differences in the means between the two variables were evaluated using Student’s t-test. Univariate Kaplan-Meier analyses and multivariable Cox regression analyses were used to analyze cumulative survival rates and RFS/PFS. All p-values were 2-sided and 2-tailed, and statistical significance was set at p<0.05.
RESULTS
Patient demographics
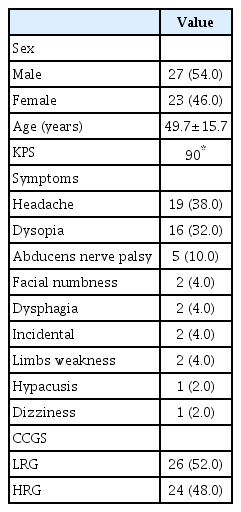
Table 1 shows the demographic characteristics of the 50 patients, including 23 women (46%) and 27 men (54%). The mean age at diagnosis was 49.7±15.7 years (range, 10–71). The patients had an average preoperative KPS score of 90 on admission. The initial symptoms were as follows : headache (n=19, 38%), dysopia (n=16, 32%), abducens nerve palsy (n=5, 10%), facial numbness (n=2, 4%), dysphagia (n=2, 4%), incidentally found (n=2, 4%), limb weakness (n=2, 4%), hypacusis (n=1, 2%), and dizziness (n=1, 2%). Accounting for tumor size, site, vascular encasement, intradural extension, brainstem involvement, and prior treatments (prior surgery or radiotherapy), each patient was scored preoperatively allocated to one of two groups : low-risk group (LRG; total score ≤7) and high-risk group (HRG; total score >8).
Tumor profiles and surgical procedures
The preoperative CT scans demonstrated bone destruction and tumor calcification. MRI revealed a pattern of tumor growth invasion. CT angiography helped to show the encasement of blood vessels. The anatomic regions with tumor invasion and surgical approaches are summarized in Table 2. The lesions mainly invaded the sellar and parasellar regions (n=21, 42%) and the clivus (n=19, 38%), and both areas were involved in six patients (12%). The other regions included the anterior cranial base (n=1, 2%), the cerebellopontine angle (n=1, 2%), the craniocervical junction (n=1, 2%), and the parapharyngeal space (n=1, 2%). The surgical approaches included endonasal endoscopy (n=18, 36%), microscopic transnasal transsphenoidal (n=18, 36%), frontotemporal, transcavernous (n=10, 20%), combined (n=2, 4%), extended subfrontal (n=1, 2%), and extreme lateral transcondylar (n=1, 2%).
Surgical outcomes
If the condition of a patient permitted it, surgical resection was performed to the maximum extent. GTR has always been the goal of surgery, but it was difficult to achieve it; it was only achieved in 12 patients (24%), 32 patients underwent STR (64%), and PR was achieved in the rest, as shown in Table 3. The most common complication was cerebrospinal fluid leakage in 14 cases, accounting for 28%; in two of these cases, intracranial infection resulted, but they improved after antibiotic treatment. Lumbar drainage was performed for eight cases, and surgical repair was performed for one case due to persistent leakage. The other complications included cranial nerve palsy (n=5, 10%), hypopituitarism (n=3, 6%), epilepsy (n=1, 2%), and epidural hematoma (n=1, 2%), for which surgery was repeated; two patients (4%) died, and the primary causes of death were intraoperative cavernous sinus hemorrhage and brainstem failure due to delayed intracerebral hemorrhage, respectively. Table 3 also listed the comparisons of GTR, STR, and PR rate between the radiotherapy and no-radiotherapy groups after operation, showing that the no-radiotherapy group have a higher percentage of GTR. The pathological results indicated that the mean Ki-67 index of all the patients was approximately 7.5% (1% to 20%). The mean KPS score on discharge was 83, and the mean length of postoperative stay was 15.3±9.7 days; if intraoperative complications occurred, postoperative hospitalization was significantly prolonged (p<0.05). Fourteen patients received radiotherapy after hospitalization, all of whom were treated with gamma knife; the average interval was 1–3 months after surgery.
Follow-up and overall prognosis
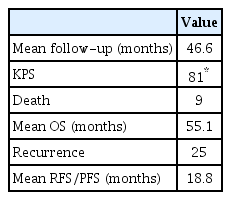
The mean follow-up duration was 46.6 months (range, 8–126), as shown in Table 4. Nine additional patients died during the follow-up. Two of them, who had KPS scores of 10, were near death on and died shortly after discharge. Two of them died 6 months later due to disease progression and inoperability. Four patients did not receive any treatment after MRI reexamination, which confirmed tumor recurrence. One patient died after undergoing two additional craniotomies in another hospital after tumor recurrence. The mean KPS score of all the patients after 6 months was 81, and the mean OS was 55.1 months. MRI examinations during follow-up showed that 25 patients had tumor recurrence or progression, and the average RFS/PFS was 18.8 months.
Clinical evaluations of LRG and HRG
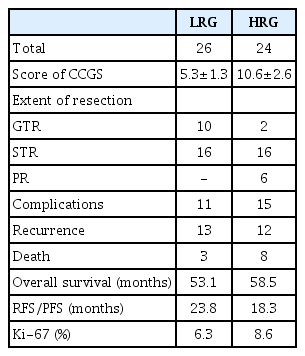
Fig. 1 and Table 5 show the patient outcomes in detail. The mean scores of the CCGS were 5.3±1.3 and 10.6±2.6 for the LRG and HRG, respectively. The mean KPS scores of both groups at different time points were statistically significant (p<0.05), which indicated that the life status of the HRG was significantly lower than that of the LRG before and after surgery and during the follow-up. Regarding the extent of resection, the GTR rate was significantly higher in the LRG than in the HRG (38.5% vs. 8.3%, p<0.05). GTR or STR was achieved in the LRG group; the cumulative value of both was only 75% for the HRG group, and all cases of PR were performed in the HRG group. There were no statistically significant differences in the incidence of complications (42.3% vs. 62.5%, p=0.15) and recurrence between the two groups (50% vs. 50%, p=0.27). The HRG had a higher mortality rate than the LRG (33.3% vs. 11.5%), but the difference was not statistically significant (p=0.13). The OS was 53.1 months and 58.5 months for the LRG and HRG, respectively, with no statistically significant difference (p=0.69). The mean RFS/PFS duration was slightly longer in the LRG than in the HRG group, but the difference was not statistically significant (p=0.29). The Ki-67 levels were 6.3% and 8.6% for the LRG and HRG, respectively.
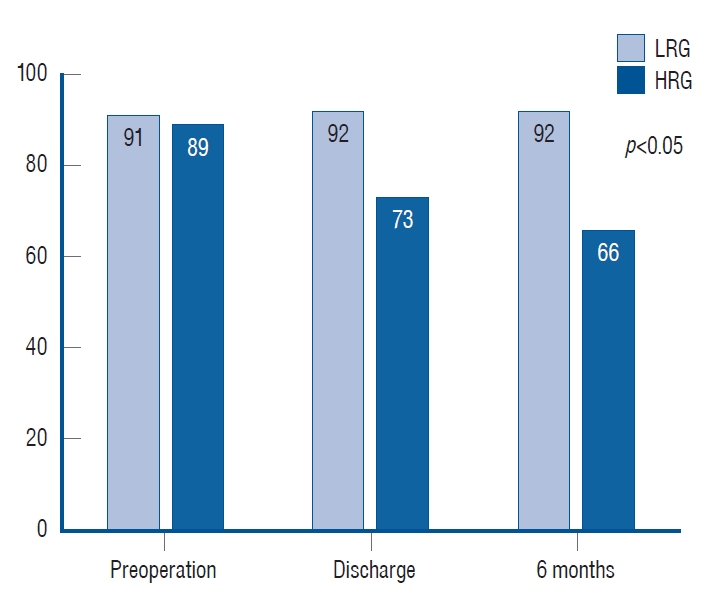
Comparison of Karnofsky Performance Scale scores in different time between the two groups. There are significant differences at all times. LRG : low-risk group, HRG : high-risk group.
Cumulative survival and RFS/PFS analysis of different factors
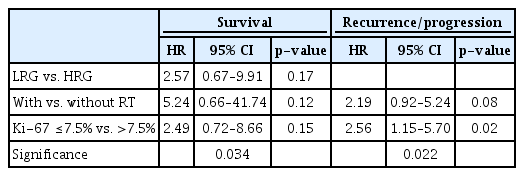
In addition to the CCGS, we assessed the effects of the degree of excision (exclude the effect of radiotherapy), the administration of radiotherapy, and the Ki-67 index on cumulative survival and RFS/PFS. As shown in Fig. 2, there were no statistical differences between the groups; however, the cumulative survival rate in the LRG group, postoperative radiotherapy group, and Ki-67 ≤7.5% group was higher than that in the corresponding group. The 5-year cumulative survival rates were 88.5% and 66.7% for the LRG and HRG, respectively, and most deaths occurred within 5 years after surgery. The RFS/PFS is shown in Fig. 3; only the Ki-67 group had statistical significance (p=0.03), which indicated that Ki-67 was associated with tumor recurrence or progression. As seen from the multivariable Cox proportional hazards model shown in Table 6, all factors with p<0.10 in the univariable analysis were included in multivariable analysis. The overall significance of survival and recurrence/progression were 0.034 and 0.022, respectively. However, the three factors included in the multivariable survival analysis only reflected an increased risk and did not reach statistical significance based on their p-values. The only statistically significant factor was Ki-67, which means that Ki-67 was an independent risk factor for tumor recurrence or progression; the probability of tumor recurrence or progression associated with Ki-67 of >7.5% was 2.56 times that associated with Ki-67 of ≤7.5% (p=0.02).

Kaplan-Meier survival curve of different factors. A : LRG vs. HRG, p=0.06. B : GTR vs. STR+PR, p=0.28. C : With RT vs. without RT, p=0.07. D : Ki-67 value, p=0.08. LRG : low-risk group, HRG : high-risk group, STR : subtotal resection, PR : partial resection, GTR : gross total resection, RT : radiotherapy.
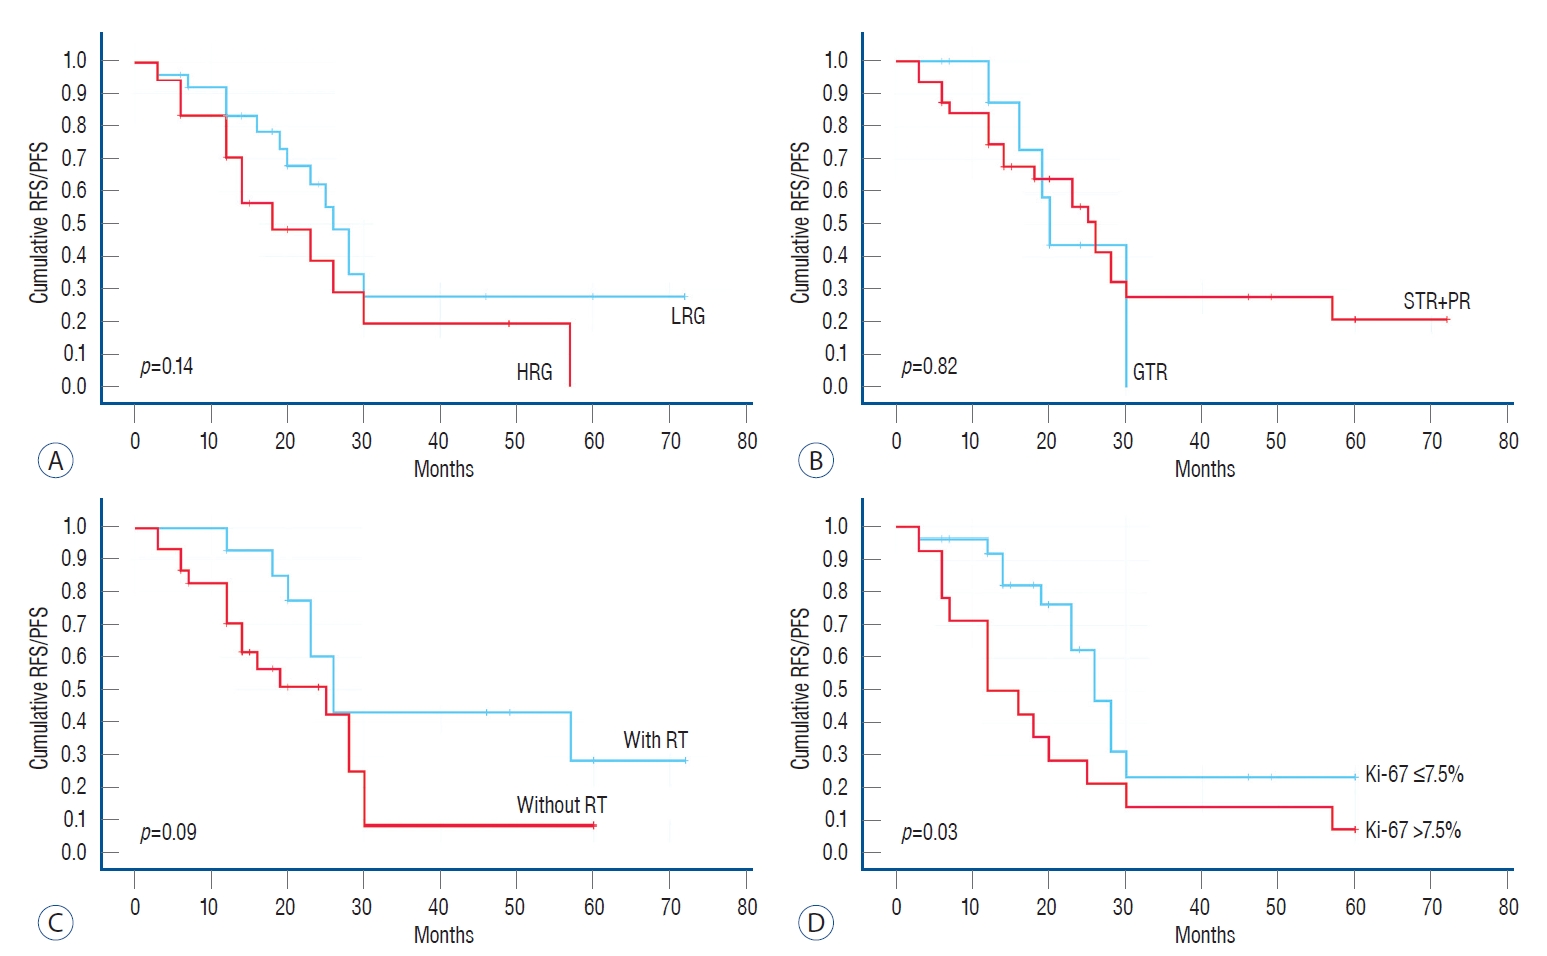
Kaplan-Meier survival curve for recurrence free survival/progression free survival (RFS/PFS) of different factors. A : LRG vs. HRG, p=0.14. B : GTR vs. STR+PR, p=0.82. C : With RT vs. without RT, p=0.09. D : Ki-67 value, p=0.03. LRG : low-risk group, HRG : high-risk group, GTR : gross total resection, STR : subtotal resection, PR : partial resection, RT : radiotherapy.
DISCUSSION
General characteristics of chordomas
The incidence of chordomas is approximately 0.08/100000 [17], and approximately one-third of the cases originate from the midline of the cranial base, which is mostly located around the clivus. In our series, the clivus and sellar regions accounted for more than 90% of the cases, and most tumors were located in the epidural areas. Primary intradural chordomas have also been reported, but they are very rare [10,18]. Chordomas have three histopathologic subtypes : conventional chordomas, chondroid chordomas, and dedifferentiated chordomas; the conventional chordomas have been reported as the most common, as in our research. The features of chondroid chordomas are similar to those of chondrosarcoma. Some literatures have reported that chondroid chordomas have better long-term outcomes; however, this was not confirmed in other series [1,11]. Differentiated chordomas are considered highly malignant [13]; this may be related to their growth pattern. Most tumors grow slowly, and, in rare cases, they stop growing and localize without metastasis to other areas [4]. Only a few are invasive, local recurrence is rapid and spreads around, and some of the recurrent tumors are more aggressive [16].
Surgical treatment and extent of resection
Surgical treatment is still preferred, as it can significantly improve OS [9]. However, it is still necessary to thoroughly consider choosing between a more aggressive or conservative approach to resection to maximize safety. In the series of Colli and Al-Mefty [5], GTR reached 77%, which improved the OS relative to STR, indicating that aggressive excision helped control recurrence. Some authors have also proposed different surgical goals, which include resection within the maximal safe range to reduce the occurrence of neurological damage and complications [14,21]. In our study, GTR was 24%, and we deliberately did not emphasize the extent of tumor resection to facilitate postoperative survival. Even so, complications and death were difficult to salvage even if STR or PR was performed for tumors with excessive growth or those close to important brain structures or blood vessels. There were no statistical differences in cumulative survival and RFS/PFS between the patients who underwent only surgery and had GTR and STR. Therefore, we believe that the extent of tumor resection did not directly affect prognosis; in other words, prognosis was affected by several factors. Aggressive resection of cranial base chordomas infiltrates the dura and clivus bone [7], which usually requires the use of extended cranial base or combined approaches. However, we used a single approach for most cases and combined approaches for only two cases, which may have contributed to the low GTR rate.
Cranial chordoma grading system
al-Mefty and Borba [1] proposed a classification based on the extent of tumor extension at the skull base in 1997, as well as the extent of tumor extension and surgical approaches selected. In 2000, Thodou et al. [25] proposed another classification of cranial base chordomas based on the anatomical location and clinical characteristics : 1) sellar chordomas, 2) parasellar tumors, and 3) tumors involving the clivus region. In 2016, Gui et al. [12] published an endoscopic classification of chordomas located within the midline and paramidline regions. The former included the anterior skull base and the upper, middle, and lower clivus, and the latter was an extension of the former to the paramedian. While these categories provided a reference for surgeons in planning surgical procedures, there was no direct correlation between the results of each category. In 2018, Brito da Silva et al. [2] proposed a new classification based on tumor size (<2, 2–4, 4–6, and >6 cm were given 1 to 4 points, respectively), site (upper/mid/lower clivus, left/right cavernous sinus, left/right petrous bone, left/right cervical C 1/2/3, 1 point for each invasion), vascular encasement by the tumor (left/right internal carotid artery, left/right vertebral artery and basilar artery, 1 point for each artery with >50% encasement), intradural extension (none, small without brainstem displacement, large with brainstem displacement, with 0–2 points, respectively), and prior treatments (2 points after surgery and 3 points after radiation). Compared with Sekhar’s three-way classification, our study used three groups based on cutoffs, but only eight patients belonged to the HRG (above 12 points). As far as this is concerned, we believe that this classification can be appropriately simplified in our study to make it more universal and try to avoid potential statistical bias. Hence, we combined these eight patients and the original intermediate-risk group into the intermediate to HRG. Eventually, the patients were divided into two groups, the LRG and HRG, in our study. The results for the GTR rate, incidence of complications, KPS, and RFS/PFS were similar to those reported in their series. In addition, we analyzed the functions for cumulative survival and RFS/PFS for both groups, showing that the LRG had a lower risk of recurrence or progression than the HRG. The results suggested that the external validation of CCGS was applicable and generalizable. CCGS was effective for preoperative evaluation and the prediction of intraoperative and postoperative outcomes.
Risk factors for tumor recurrence or progression
Previous publications demonstrated that age, tumor location, tumor size, and history of recurrence were associated with tumor recurrence [15,26]. Anecdotal evidence shows that en bloc resection minimizes tumor recurrence, but our study showed that GTR, compared with STR/PR, does not improve tumor recurrence during follow-up, which is consistent with reports by previous studies [3]. For tumors with a high rate of recurrence, attention should be paid to the preservation of neurological function and the quality of life rather than aggressive resection to improve the chances of cure [6]. Large tumors, especially those involving the vital neurovascular structures or the brainstem, increase the difficulty of surgical resection. Tumors are usually easily retained in these areas, which is also an important reason for recurrence or progression.
The 5-year OS in our series was 78%. This was consistent with that reported in a meta-analysis published by Di Maio et al. [8], who concluded on an overall 5-year survival rate of 70–78%. In the cumulative survival analysis, none of the four factors included in this study reached statistical significance, and the p-values of the three factors were close to 0.05, suggesting that being in the LRG, radiotherapy, and Ki-67 ≤7.5% were associated with OS. Furthermore, the mean OS of patients treated with radiotherapy after surgery was 76.9 months, which was significantly higher than that of those who did not receive radiotherapy (49.7 months); the RFS/PFS was 33.1 months with radiotherapy and 16.1 months without radiotherapy. On the other hand, our results indicated that radiotherapy may help prolong OS and RFS/PFS, and then no visible mass on the MRI might suggest prophylactic radiotherapy. Advances in radiation technology have led to the strategic targeting of neoplasms with higher doses of radiation. There is some consensus that radiation therapy in combination with surgery provides an added advantage [27]. Therefore, adjuvant radiotherapy is recommended after surgery, even for inoperable patients [24]. However, the effectiveness of gamma knife depends on small tumor size and adequate marginal dose, otherwise, excessive doses would exceed the tolerance of most neural structures, particularly the brain stem and visual pathways.
Few publications have used pathological markers as predictors of tumor recurrence or progression. Ki-67 is an antigen related to proliferating cells, which is mainly used to label cells during the proliferating cycle, reflecting the growth rate of tumors to a certain extent. From our results, Ki-67 of >7.5% was associated with a decrease in OS and RFS/PFS, especially RFS/PFS, and the risk of recurrence increased sharply; there was a 2.56-fold increased risk of recurrence or progression when from that associated with Ki-67 of ≤7.5%. As a result, Ki-67 can be considered an independent risk factor for tumor recurrence or progression.
Limitations of this study
First, our study was retrospective, and a significant number of patients had a very short follow-up. Second, the surgeries were performed by different neurosurgeons, and there were differences in the philosophy of surgical approaches and techniques. Third, due to the limited number of patients receiving radiotherapy, it was difficult to determine its effect and evaluate its prognosis in combination with the extent of surgical resection. Last, no consistent criteria were established to determine the need for radiotherapy or the total dose to be administered to the tumor.
CONCLUSION
Surgery is currently the mainstay of treatment for chordomas, and GTR is always the desired outcome, especially for the LRG. Radiotherapy remains an option, and it can prolong OS and RFS/PFS. The significance of histopathological results in predicting tumor recurrence or progression should be emphasized. The CCGS provides a practical tool for neurosurgeons to predict surgical outcomes and determine therapeutic priorities. The treatment of chordomas still requires the active participation of neurologists, radiologists, pathologists, and other departments to improve prognosis.
Notes
Conflicts of interest
No potential conflict of interest relevant to this article was reported.
Informed consent
This type of study does not require informed consent.
Author contributions
Conceptualization : BW; Data curation : BW, FT; Formal analysis : BW; Funding acquisition : XT; Methodology : BW; Project administration : XT; Visualization : BW; Writing - original draft : BW; Writing - review & editing : XT
Data sharing
None
Preprint
None
Acknowledgements
This project was supported by the Foundation for Science and Technology Major Project of Tianjin (Grant No. 18ZXDBSY00180).

