Histological Changes of Cervical Disc Tissue in Patients with Degenerative Ossification
Article information

Abstract
Objective
To explore the histological feature of the cervical disc degeneration in patients with degenerative ossification (DO) and its potential mechanisms.
Methods
A total of 96 surgical segments, from cervical disc degenerative disease patients with surgical treatment, were divided into ossification group (group O, n=46) and non-ossification group (group NO, n=50) based on preoperative radiological exams. Samples of disc tissues and osteophytes were harvested during the decompression operation. The hematoxylin-eosin staining, Masson trichrome staining and Safranin O-fast green staining were used to compare the histological differences between the two groups. And the distribution and content of transforming growth factor (TGF)-β1, p-Smad2 and p-Smad3 between the two groups were compared by a semi-quantitative immunohistochemistry (IHC) method.
Results
For all the disc tissues, the content of disc cells and collagen fibers decreased gradually from the outer annulus fibrosus (OAF) to the central nucleus pulposus (NP). Compared with group NO, the number of disc cells in group O increased significantly. But for proteoglycan in the inner annulus fibrosus (IAF) and NP, the content in group O decreased significantly. IHC analysis showed that TGF-β1, p-Smad2, and p-Smad3 were detected in all tissues. For group O, the content of TGF-β1 in the OAF and NP was significantly higher than that in group NO. For p-Smad2 in IAF and p-Smad3 in OAF, the content in group O were significantly higher than group NO.
Conclusion
Histologically, cervical disc degeneration in patients with DO is more severe than that without DO. Local higher content of TGF-β1, p-Smad2, and p-Smad3 are involved in the disc degeneration with DO. Further studies with multi-approach analyses are needed to better understand the role of TGF-β/Smads signaling pathway in the disc degeneration with DO.
INTRODUCTION
Cervical intervertebral disc degeneration with aging has been a major cause to the cervical disc degenerative disease (CDDD). Local degenerative ossification (DO), which includes different kinds of osteophytes or ossifications around the degenerative disc tissues, may cause a more severe neural compression and result in a more challenging decompression operation as well. Heterotopic ossification after cervical disc arthroplasty that also belongs to DO can significantly decrease the range of motion of the surgical segment and increase the risk of reoperation. Therefore, it’s important to clarifying the histological changes of cervical disc tissue after DO and the underlying mechanisms, which are critical for the treatment of CDDD in clinic. However, the histological changes and the underlying mechanism of DO has not been reported yet.
A large number of studies have explored the potential causes of cervical disc degeneration based on different animal models or cadaver studies. However, previous researches yielded different even conflicting results for the potential mechanism. And it’s not convincible to analogize the results to clinic because of different anatomical characteristics and biomechanical features of cervical spine among species, especially with humans. A more reliable way to explore the causes of CDDD is to directly detect the changes of human degenerative disc tissues.
The intervertebral disc degenerates with age, and some of them may be accompanied by different kinds of DO. Is there any potential correlation between the two degeneration processes? Transforming growth factor (TGF)-β/Smads signaling pathway has been widely studied for its role in the disc degeneration and osteophyte formation. The results showed that TGF-β/Smads signaling pathway is involved in disc degeneration, and it also plays an important role in the ossification of the posterior longitudinal ligaments (OPLL) [12,18]. Therefore, we wonder that whether the TGF-β/Smads signaling pathway is a potential factor for the interaction between disc degeneration and DO. And that is also the reason why we explore the mechanism of disc degeneration with DO through TGF-β/Smads signaling pathway in this study.
The aim of this study is to examine the histological changes in CDDD patients with DO and preliminarily explore the potential role of TGF-β/Smads signaling pathway in the development of cervical DO. Here, totally 96 cervical disc tissues from CDDD patients with and without DO were harvested and divided into ossified and non-ossified group. General histological staining was used to compare differences of intervertebral disc cells and extracellular matrix between the two groups. And the expression of TGF-β1, downstream p-Smad2 and 3 was also detected and compared by a semi-quantitative immunohistochemistry (IHC) method.
MATERIALS AND METHODS
Ethical approval
This study was approved by the Ethics Committee of Dongzhimen Hospital Affiliated to Beijing University of Chinese Medicine (DZMEC-KY-2019-94).
Inclusion and exclusion criteria
Inclusion criteria : 1) patients were diagnosed with symptomatic CDDD based on the clinical and radiological evidence; 2) patients underwent surgery treatment for the first time after attempted conservative treatment for at least 6 weeks; and 3) the surgical treatment includes anterior cervical discectomy and fusion and/or cervical disc arthroplasty.
Exclusion criteria : 1) patients with a history of cervical trauma or previous cervical spinal surgery; 2) complete collapse of intervertebral space was found from the preoperative radiological exams; and 3) sufficient tissue samples could not be obtained during the operation.
Tissue sources and grouping criteria
For selected patients (n=59), samples of the intervertebral disc tissue (n=96) and the osteophyte (n=38) were harvested during the routine discectomy or nerve decompression operation, and the disc tissue size was required to be no less than 5× 5×1.5 mm3. Disc samples from different segments were divided into ossification group (group O) and non-ossification group (group NO) according to the preoperative cervical plain radiographs and computed tomographic scans. Samples in the group O (n=46) met the following conditions : 1) osteophytes were found at the anterior or posterior of the vertebral body; 2) ossification of the disc protrusion, OPLL or ossification of ligamentum flavum was found; 3) hyperplasia of lateral uncinate joints; and 4) focal osteophytes were found around the surgical segment. Two typical cases of DO are shown in Fig. 1. Patients with any ossification segment were enrolled in group O. A summary of enrolled patients and samples was presented in Table 1.
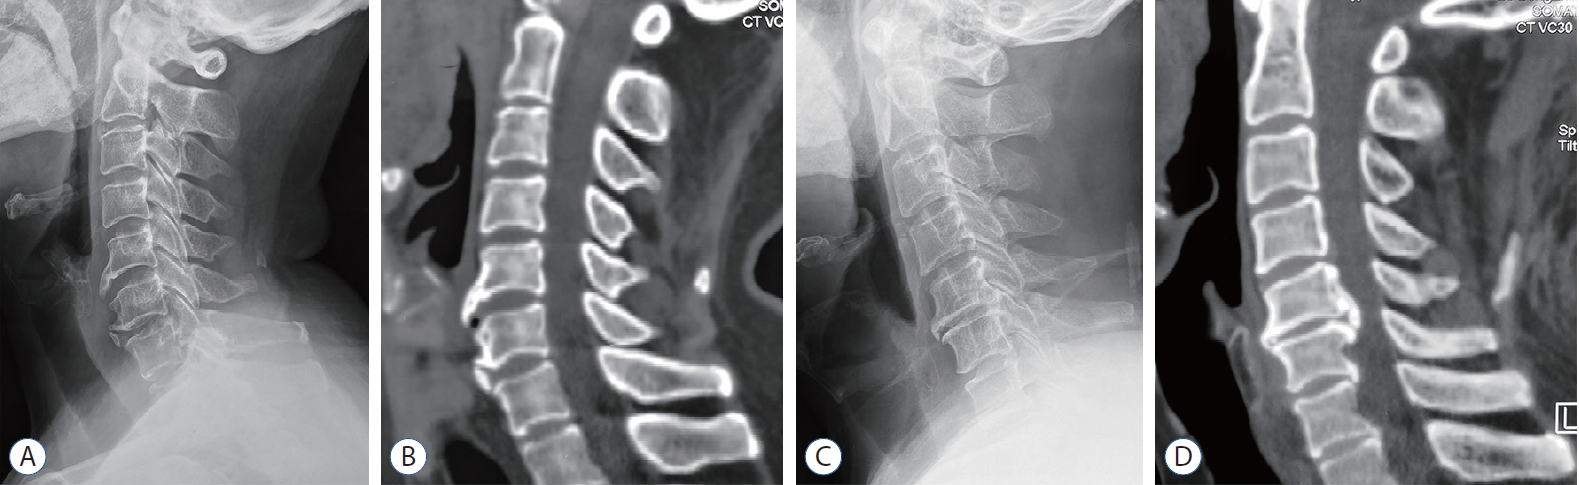
The DO around the surgical segments in group O. A and B : Preoperative X-ray and computed tomographic (CT) examination showed that the osteophytes were found in front of the C5-6 and C6-7, respectively. C and D : Preoperative X-ray and CT examination showed the osteophytes were found both in front and behind C5-6.
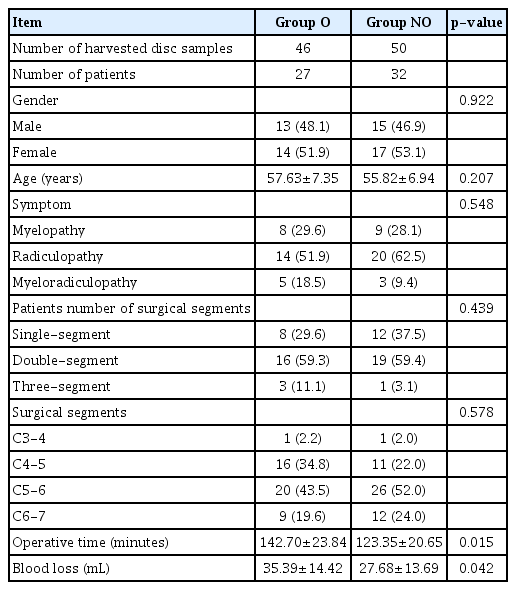
A summary of general data of enrolled patients and samples
All the radiologic outcomes were assessed by two surgeons independently. When the opinions differed, a third senior surgeon was involved in decision.
Sample preparation
All samples were harvested and fixed in 4% paraformaldehyde solution for 48 hours. After decalcification with EDTA (E1171; Solarbio, Beijing, China) for 3 weeks at 4°C, all tissues were dehydrated by an increasing ethanol series followed by incubation in xylene and embedded in paraffin. Finally, samples were sliced in 5 µm paraffin sections.
General histological and IHC staining
Hematoxylin-eosin (HE) staining was used to evaluate general histopathological findings of disc tissues. A modified Masson trichrome staining kit (G1345; Solarbio) was used to observe collagen fibers in the intervertebral disc. And the distribution and content of extracellular cartilage matrix in the intervertebral disc were stained by a modified Safranin O-fast green staining kit (G1371; Solarbio).
The expression and distribution of TGF-β1 and downstream p-Smad2 and p-Smad3 were observed by a standard immunohistochemical staining protocol. Sections were incubated with primary antibodies to TGF-β1 (1 : 200, ab92486; Abcam, Cambridge, UK) or p-Smad2 (1 : 200, AF3449; Affinity, Changzhou, China) or p-Smad3 (1 : 120, AF3362; Affinity) at 4°C overnight. IHC was performed using an UltraSensitive TM SP (rabbit) IHC Kit (KIT-9706; Maixin, Fuzhou, China). Triplicates of each sample were used for staining.
Semi-quantitative analysis
Histological photographs were taken using a Leica DM4B microscope with attached Leica DMC5400 digital camera at a same setting. For the semi-quantitative detection, the average optical density was analyzed by Image-Pro Plus 6.0 software (Media Cybernetics, Silver Spring, MD, USA) with three random visual fields in each section.
Statistical analysis
The SPSS software (version 22.0; IBM, Armonk, NY, USA) was used for statistical analysis. Proportional data for patient demographics were compared using chi-square methods. All measurement data were expressed as mean±standard deviation. Independent-samples t test or Mann-Whitney U tests were used for comparing qualitative data between the two groups. A p-value <0.05 was considered statistically significant.
RESULTS
Patient demographics
Compared with group NO, the operative time and the blood loss in group O were significantly increased.
General histological observations
The human intervertebral disc tissues harvested from CDDD patients with or without ossification were sectioned for histological evaluations with HE staining, modified Masson trichrome staining and Safranin O-fast green staining. Histologically, HE staining images showed that the collagen fiber bundles (CFB) in all the samples had different arrangement and assembly in different locations, from the outer annulus fibrosus (OAF) to the inner annulus fibrosus (IAF) and then the nucleus pulposus (NP). The CFB in OFA were parallel to each other with a dense packing, forming a concentric structure. At the same time, there were a large number of fibroblast-like cells in the OAF, which were slender and spindle-shaped, arranged in strings along the axis of CFB. The CFB in the IAF were arranged in a crisscross pattern, and there were many oval- or spherical-shaped chondrocyte-like cells, scattered throughout the IAF. In NP, the CFB were relatively unclear and arranged sparsely. The density of local resident cells decreased obviously. Some chondrocyte-like cells were scattered, and some others were clustered together similar to the notochord cell with occasional vacuoles. Bone trabeculae and marrow cavity that contained osteoblasts and osteoclasts, were found in the osteophytes from group O. Besides, semiquantitative analysis showed that the number of cells in all parts of group O was significantly higher than that of group NO (in OAF, p<0.001, IAF and NP, p=0.035 and 0.005), indicating a more severe degenerative process of the disc tissue with a pathological multiplication of the disc cells in group O (Fig. 2A, B, 3A, and B).

General histological staining of the osteophyte. A : Hematoxylin-eosin (HE) stain, ×100. B : HE stain, ×400, the black arrow indicates osteoblasts, and the white arrow indicates osteoclasts. C : Modified Masson trichrome stain, ×100. D : Modified Safranin O-fast green cartilage stain, ×100.

General histological staining and semi-quantitative comparison of the disc tissue. A : Hematoxylin-eosin (HE) staining, ×100. B : Comparison of cell counts in disc tissues. C : Modified Masson trichrome staining, ×100. D : Comparison of collagen fiber content. E : Modified Safranin O-fast green cartilage staining, ×200. F : Comparison of proteoglycan content. *p<0.05. †p<0.001. Group O : ossification group, group NO : non-ossification group, OAF : outer annulus fibrosus, IAF : inner annulus fibrosus, NP : nucleus pulposus, AOD : average optical density
Modified Masson trichrome staining further confirmed that the number of collagen fibers decreased gradually from the OAF to the NP, but there was no significant difference between the two groups (in OAF, IAF and NP, p=0.829, 0.165, and 0.108). The trabecular staining in osteophytes was similar to the OAF, showing blue-staining collagen (Fig. 2C, 3C, and D).
Modified Safranin O-fast green staining showed that the positive red staining was mainly distributed in NP and IAF. Semi-quantitative analysis showed that the positive red staining in IAF and NP of the group O was significantly lower than that of the group NO (in OAF, IAF and NP, p=0.401, 0.017, and 0.043), indicating the disc degeneration in group O was more severe with significant loss of proteoglycans in the matrix. For osteophyte tissues, proliferating and hypertrophic chondrocytes (red stained) were also found around the trabecular (green/gray-green) besides osteoblasts and osteoclasts, which indicated that the development of the osteophyte might be a dynamic process and mainly formed by endochondral osteogenesis (Fig. 2D, 3E, and F).
IHC staining
TGF-β1, p-Smad2 and p-Smad3 were detected in all parts of the disc tissues (Fig. 4A, C, and E). In OAF, TGF-β1 was mainly located on the surface of the fibroblast-like cell membrane and in the cytoplasm, while in IAF and NP, it was mainly distributed on the surface of chondrocyte-like cells and in the nucleus. For osteophytes, the TGF-β1, p-Smad2 and p-Smad3 were mainly expressed in the extracellular matrix of the bone marrow cavity, and few amount of expression was also found in the bone lacunae (Fig. 5). Semi-quantitative analysis showed that, for group O, the expression of TGF-β1 in the OAF and NP was significantly higher than that in group NO (in OAF, IAF and NP, p=0.001, 0.09, and <0.001). And p-Smad2 in the IAF and p-Smad3 in the OAF were significantly higher than that of group NO (for p-Smad2 in OAF, IAF, and NP, p=0.071, 0.040, and 0.317; for p-Smad3, p=0.022, 0.158, and 0.282; Fig. 4B, D, and F).
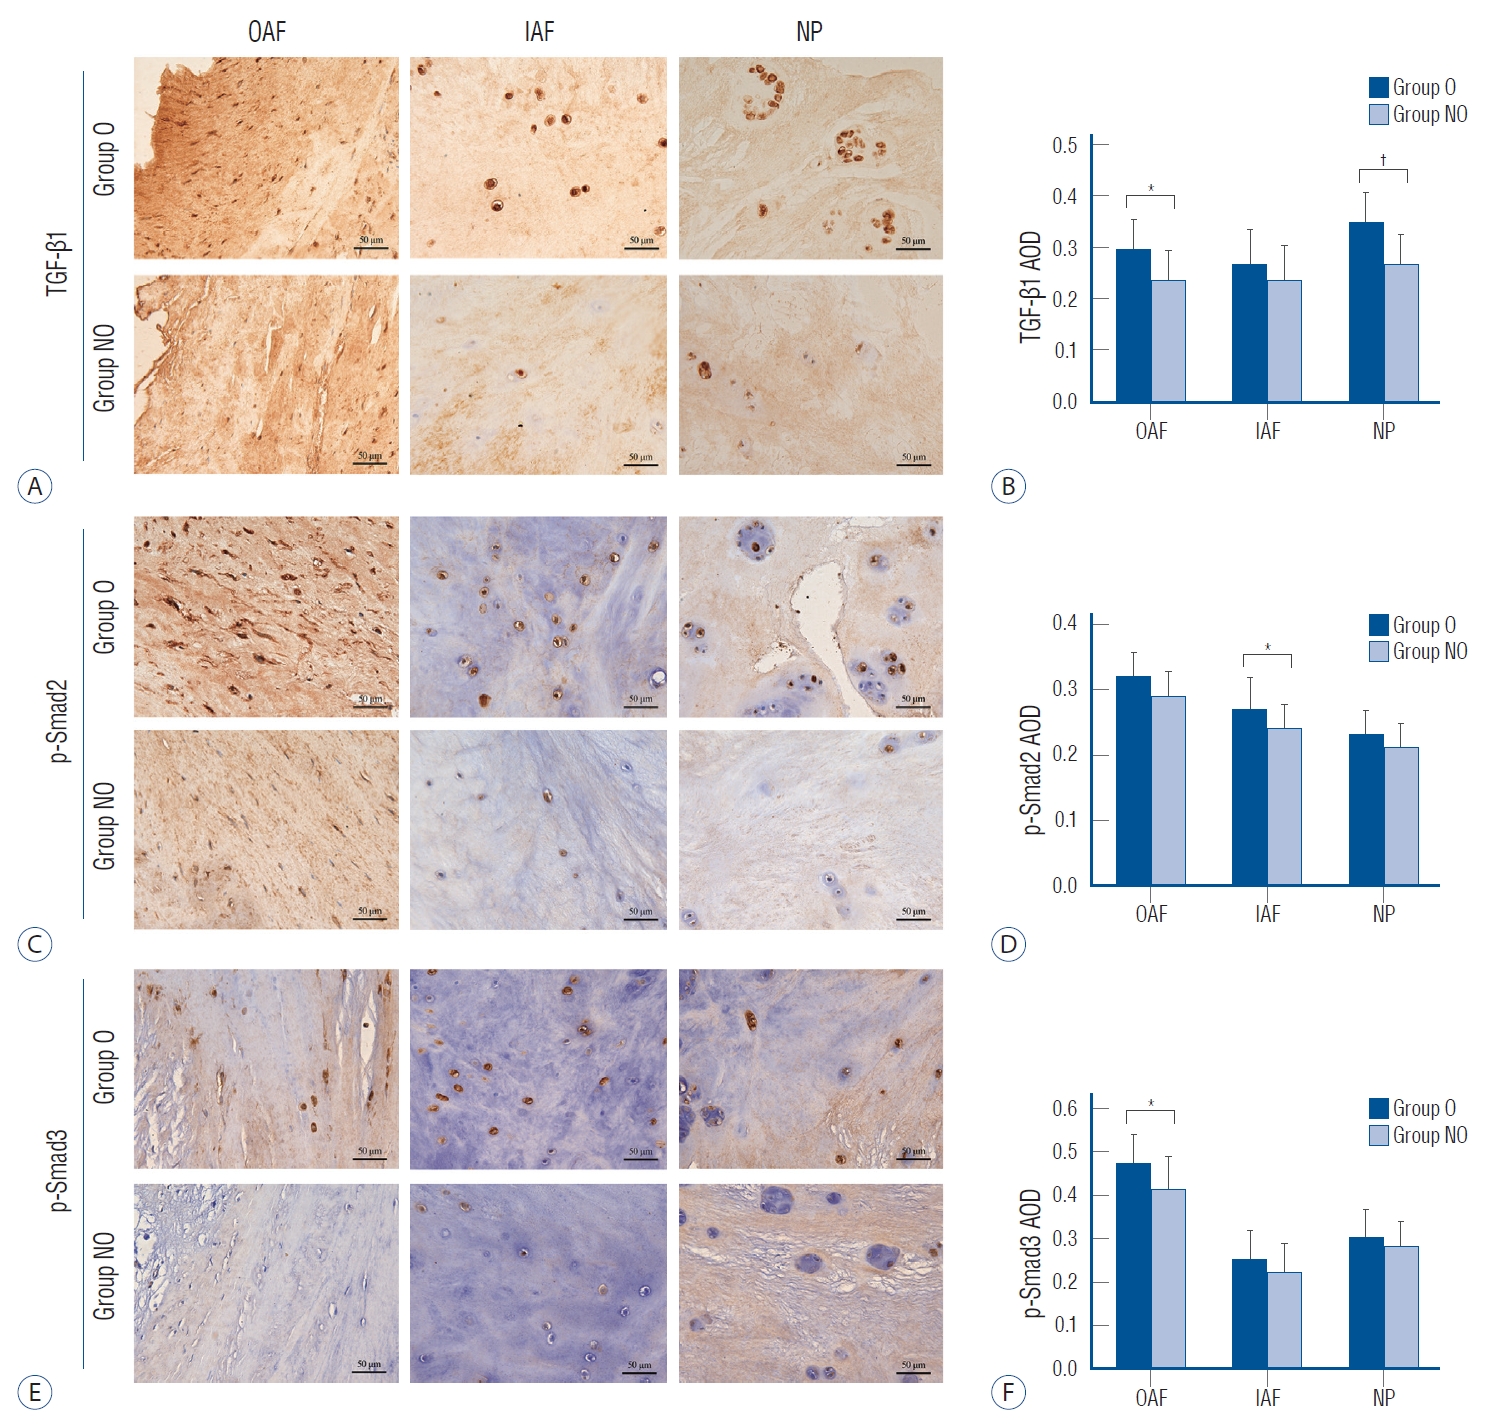
Immunohistochemistry (IHC) staining and semi-quantitative comparison of the disc tissue. A, C, and E : The IHC staining of TGF-β1, p-Smad2, and p-Smad3, ×200. B, D, and F : Comparison of the AOD of TGF-β1, p-Smad2, and p-Smad3, respectively. *p<0.05. †p<0.001. TGF : transforming growth factor, group O : ossification group, group NO : non-ossification group, OAF : outer annulus fibrosus, IAF : inner annulus fibrosus, NP : nucleus pulposus, AOD : average optical density.
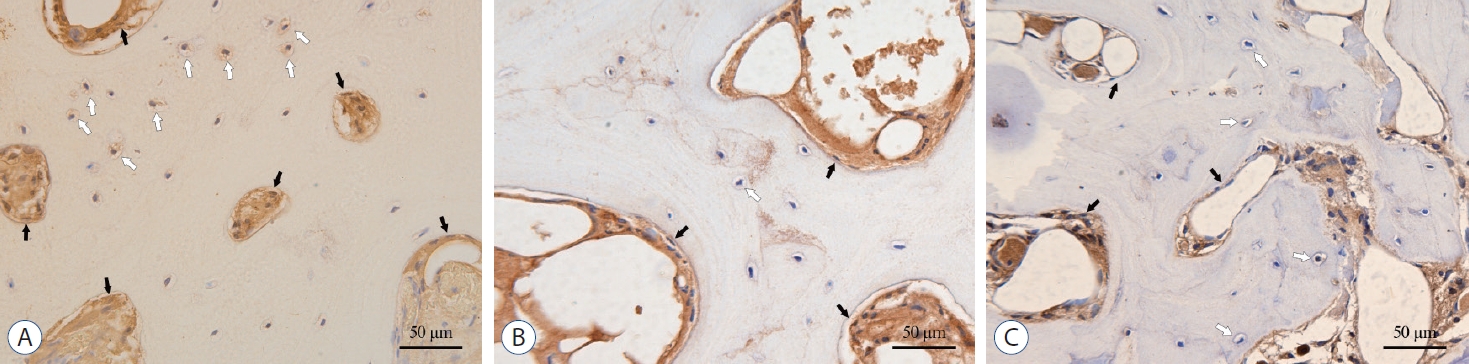
Immunohistochemistry staining of the osteophyte, ×200. Black arrows showed osteoblasts and white arrows showed osteocytes. A : For transforming growth factor-β1. B : For p-Smad2. C : For p-Smad3.
DISCUSSION
The current study demonstrates that the cervical disc degeneration in DO patients was more severe than that of non-DO patients. The main histological changes included an increased number of resident cells in the disc substructure and decreased of the content of proteoglycan in extracellular matrix. The development of the osteophyte might be a dynamic endochondral osteogenesis process. In clinical practice, in order to achieve sufficient decompression, which requires removing the compressed discs and osteophytes thoroughly, the operative time and blood loss in DO patients were also increased. Previous studies reported that the TGF-β/Smads signaling pathway are involved in the disc degeneration. And TGF-β gene, especially TGF-β1, are also considered the major candidates promoting the susceptibility to OPLL, because of its significance in controlling bone metabolism [12,18]. This leads us to wonder whether the TGF-β/Smads signaling pathway is a potential factor for the interaction between disc degeneration and DO. Thus, it encourages us to explore the mechanism of disc degeneration with DO through TGF-β/Smads signaling pathway. In this study, TGF-β1/Smad2/3 pathway was involved in the disc degeneration of all CDDD patients. For DO patients, the local higher expression of TGF-β1 in OAF and NP may have some potential roles in both disc degeneration and the development of local osteophyte. However, since the inconsistency of expression of the p-Smad2 and p-Smad3, their roles may also vary.
Based on a histological scoring method proposed by Rutges et al. [22], DO patients had a higher score of 8 when compared with non-DO patients (4 points). The differences in histological scores included : 1) loss of half ring-shaped collagen lamellae structure in the annulus fibrosus; 2) mainly clustered cellularity and chondroid nests present in the NP; 3) disorganized structure of the NP matrix; and 4) decreased red and increased green staining of the NP matrix in the Safranin O-fast green staining. Gullbrand et al. [7] evaluated disc degeneration based on a goat model, and pointed out that an increased fibrosis and decreased proteoglycan staining in the NP could occurred with the development of disc degeneration. These findings are consistent with the staining results of DO patients in this study, who had more severe disc degeneration.
Cervical disc degeneration is a lengthy and complex process. Several animal models have been developed using a variety of different mechanisms to simulate disc degeneration. Wu et al. [28] established a rabbit degeneration model and found that the content of proteoglycan and collagen II in the intervertebral disc reduced but collagen I increased. And similar results had also been founded in mice, rat, goats, pig and primates [2,6,11,21]. However, the majority of animal models are quadrupeds as bipedal models. With the species and biomechanical differences, these animal models cannot fully replicate the inherently complex process of the human cervical disc degeneration [5]. Thus, in order to detect the histological feature of the CDDD patients with DO and its potential mechanisms, the disc tissue from CDDD patients in this study can provide an ideal sample for the study.
In this study, TGF-β1 and downstream p-Smad2 and p-Smad3 were all detected in both disc tissues and osteophytes. And the concentration in group O was significantly higher than that of group NO. These results indicated that local excessive concentration of TGF-β1/Smad2/3 signaling factors might have been involved in both the disc degeneration and the development of the osteophytes around the disc tissue. The excessive TGF-β1/Smad2/3 signaling factors might result from the increased cell secretion and the induction of excessive mechanical loading. In addition, it has been reported that Smad3 may exert more effect on postpartum mature discs, while Smad2 play a more important role in the embryonic development period [13,16]. In this study, p-Smad2 in the IAF and p-Smad3 in the OAF were significantly higher in group O than in group NO. This indicated that, for disc degeneration with DO, the p-Smad2 and p-Smad3 might have different effects.
TGF-β signaling pathway is involved in the whole process of intervertebral disc growth and development. In the embryonic period, TGF-β can induce the undifferentiated mesenchymal cells differentiate into notochord cells and chondrocyte-like cells [19], and promote the migration, adhesion and differentiation of the sclerotome cells [27]. When the TGF-β signaling factor is mutated or artificially blocked, it can lead to dysplasia of the spine, even loss of the intervertebral disc [10,14,20]. In the postpartum period, the TGF-β signaling factor mainly comes from the secretion of nucleus pulposus cells and chondrocyte-like cells. It interacts with other cytokines in the microenvironment to maintain the homeostasis of intervertebral disc. Thus, the TGF-β is reported to be an anabolic factor for intervertebral disc [10]. It can not only induce bone marrow-derived mesenchymal stem cells differentiate into chondrocytes, and promote the synthesis and secretion of type II collagen and proteoglycan, but also inhibit the degradation of matrix [9,23,25,30].
So far, the exact role of TGF-β on human disc degeneration is still controversial. Previous researches yielded different even conflicting results based on different experimental methods and materials. Some studies suggested that the reduction of TGF-β1 leading decline of anabolic synthesis was the main cause of disc degeneration [1,3,26]. However, recent studies have shown that the expression of TGF-β1 in degenerative disc tissues was significantly increased [8,24], local excessively high concentration of TGF-β might accelerate the disc degeneration [15,29]. Additionally, abnormal expression of TGF-β might also lead to the decrease of type II collagen and the increase of type I collagen [4,17]. Appropriate mechanical stimulation can induce the TGF-β in a suitable concentration range to promote the growth and development of the intervertebral disc. But excessive external mechanical loading can induce cytoskeleton changes and release excessive TGF-β from its potential form by the integrin. And that will further aggravate the disc degeneration, including matrix degradation and disruption of intracellular homeostasis.
In short, our study demonstrates that the presence of DO indicates the CDDD patient may have more severe disc degeneration in histology, and local excessive TGF-β1/Smad2/3 signaling factors may be involved in the development of this process. These results provide us a direct insight into the histological feature of the CDDD with DO and a valuable clue to explore the potential mechanisms. In clinical practice, it informs us that the operative time and blood loss in DO patients may increase and surgeons should be more careful in the decompression procedure. Further researches need to focus on the following aspects : 1) microstructure changes of the collagen in disc tissues; 2) the interaction of the osteogenic factors, including bone morphogenetic protein-2, osteoprotegerin, and their comprehensive role in DO; and 3) the effect of different surgeries with varying implants on the development of postoperative DO.
CONCLUSION
Compare with patients without DO, the histological degeneration of the intervertebral disc in CDDD patients with DO is more severe. The osteophytes might form by endochondral osteogenesis. Higher content with varying distributed of TGF-β1 is involved in the disc degeneration and the development of DO. Downstream activated p-Smad2 and p-Smad3 may play different roles in the process of DO.
Notes
CONFLICTS OF INTEREST
No potential conflict of interest relevant to this article was reported.
INFORMED CONSENT
Informed consent was obtained from all individual participants included in this study.
AUTHOR CONTRIBUTIONS
Conceptualization : YX, XY
Data curation : YLY, YX
Formal analysis : YX, YLY
Funding acquisition : XMW
Methodology : YLY, YSG
Project administration : XY
Visualization : YX, YLY
Writing - original draft : YX, YLY
Writing - review & editing : YX, YLY, YSG, XMW, XY
Acknowledgements
This study was supported by the National Key R&D Program of China (2020YFC1107600) and Shandong Province Key R&D Program of China (2019JZZY011106).