Clinical Outcomes after Spinal Cord Stimulation According to Pain Characteristics
Article information

Abstract
Objective
Spinal cord stimulation (SCS) is an effective treatment for chronic neuropathic pain. However, its clinical efficacy in regard to specific types of pain has not been well studied. The primary objective of this study was to retrospectively analyze the clinical outcomes of paddle-type SCS according to the type of neuropathic pain.
Methods
Seventeen patients who underwent paddle-lead SCS at our hospital were examined. Clinical outcomes were evaluated pre- and postoperatively (3 months, 1 year, and last follow-up) using the Neuropathic Pain Symptom Inventory (NPSI). The NPSI categorizes pain as superficial, deep, paroxysmal, evoked, or dysesthesia and assess the duration of the pain (pain time score). Changes in NPSI scores were compared with change in Visual analogue scale (VAS) scores.
Results
After SCS, the pain time score improved by 45% (independent t-test, p=0.0002) and the deep pain score improved by 58% (independent t-test, p=0.001). Improvements in the pain time score significantly correlated with improvements in the VAS score (r=0.667, p=0.003, Spearman correlation). Additionally, the morphine milligram equivalent value was markedly lower after vs. before surgery (~49 mg, pared t-test, p=0.002). No preoperative value was associated with clinical outcome.
Conclusion
The NPSI is a useful tool for evaluating the therapeutic effects of SCS. Chronic use of a paddle-type spinal cord stimulation improved the deep pain and the pain time scores.
INTRODUCTION
Spinal cord stimulation (SCS) is a useful treatment for several chronic intractable neuropathic pain syndromes [17,20]. SCS outcome and pain intensity are conventionally assessed using a simple tool called the Visual analog scale (VAS) [8,19,23]. The VAS merely quantifies the degree of unpleasantness of pain; it provides little information on the characteristics of pain [19,20,30]. Most patients with chronic neuropathic pain experience complicated sensations causing multiple types of pain [3,7,9,33], including ongoing (superficial and deep) pain, paroxysmal pain, allodynia, and dysesthesia [9,43]. The complex nature of neuropathic pain may account in part for the heterogeneity of clinical results [3,9,26,33].
To date, few studies have investigated the clinical outcomes of SCS in relation to the type of neuropathic pain. Tools for evaluating diverse pain manifestation include the McGill pain questionnaire and the Pain Catastrophizing Scale [16,25]. However, manifestations such as superficial pain, deep pain, paroxysmal pain and dysesthesia are not segregated in these examinations. To address the complexity of neuropathic pain, Bouhassira et al. [5] developed the Neuropathic Pain Symptom Inventory (NPSI) in 2004. This study used the NPSI to assess complex nature of neuropathic pain with the segregated manner.
Opioid overuse is currently a major clinical problem, especially in the United States where it has reached epidemic level [36]. Previous studies have shown that opioid overuse decreases the clinical effectiveness of SCS [13] and worsens SCS outcomes [39]. Hence, reducing opioid dependency is an important clinical concern in SCS therapy.
This study used the NPSI to assess the effects of SCS on different types of pain. We also evaluated the relationship between opioid intake and NPSI scores, as well as the relationship between baseline characteristics (e.g., including pain severity, psychiatric metrics, and disease status) and clinical outcomes.
MATERIALS AND METHODS
The study design was approved by the Institutional Review Board of Soonchunhyang University Bucheon Hospital (2018-10-016-002). For this type of study, patient’s consent is not required.
The study included 17 consecutive patients who underwent implantation of a paddle-type spinal cord stimulator and were fully investigated using the NPSI at our hospital between April 2014 and July 2019. Medical records before and for more than 12 months after surgery were examined retrospectively. All patients had intractable neuropathic pain, such as failed back surgery syndrome (FBSS), complex regional pain syndrome (CRPS) or myelopathy-related pain. The average time from implantation to the last NPSI assessment was 28.5 months. Disease duration, defined as the period from the onset of intractable neuropathic pain to implantation, ranged from 13 months to 35 years and averaged 115 months. Detailed information about each patient is summarized in Table 1.

Summary of characteristics of each patient
Pain measurement
To quantify the degree of pain suffered by the patients, the VAS and NPSI were used [5]. The NPSI comprises 12 questions : 10 on the quality of the pain and two on the quantity of the pain (i.e., the duration of pain experienced per day). The quality of pain was categorized as superficial, deep, paroxysmal, evoked, or dysaesthetic. Each quality of pain question was scored 0−10 according to the five-pain categories. Each quantity of pain question was scored 0−5, and the scores for the two quantity of pain questions were summed (range, 0−10), which was defined as the “pain time score.” The “NPSI total score” was defined as the sum of all scores. NPSI scores were determined before surgery (baseline) and after surgery (at 3 months, at 1 year, and the last follow-up). The original version of NPSI was described in French. We used Korean version of NPSI, which was translated from an English version by the corresponding author (M.C.) (Supplementary Text 1).
Psychiatric evaluation
All patients completed preoperative psychiatric evaluation using the Minnesota Multiphasic Personality Inventory-2 (MMPI-2), Patient Health Questinnaire (PHQ)-9, and PHQ-15. Among the various scales of MMPI-2, only the hypochondriasis, hysteria, and depression scales were used for analyses in this study, since they were known to be the most relevant factors in SCS therapy [31,32]. PHQ-9 and PHQ-15 were used to verify whether the patients were suffering from depression and to assess the degree of somatization, which might affect the severity of the neuropathic pain. The aforementioned psychiatric evaluation scales were used in the form of raw scores, to evaluate the baseline characteristics, which may potentially influence the outcome of SCS.
Operative procedures
Under general anesthesia, the patient was placed in the prone position. Partial or total laminectomy was performed using a para-median or midline approach. To secure adequate space for the introduction of the paddle-lead, the minimum width and length of the laminectomy were 1.2 and 1.5 cm, respectively. The electrode was placed in the posterior spinal epidural space, and the spinal level where the electrode was located was confirmed using a portable fluoroscope. It is well known that paresthesia induced by cord stimulation should cover the area of chronic pain of the body to obtain SCS induced analgesia. For SCS-induced paresthesia suitably covering the neuropathic pain area, we used the map titled “probability-of-paresthesia” described by Holsheimef et al. [15] to determine the spinal levels which would be stimulated by SCS. After the implantation of the electrode, the extension wire was connected to it, and was externalized for the test stimulation.
During the test stimulation, if the patient experienced pain relief greater than 50% compared to the baseline, the pulse generator was implanted under general anesthesia, in a second operation. The wire from the lead was tunneled through the subcutaneous layer to the pulse generator. The pulse generator was implanted in the subcutaneous layer of the chest, abdomen or buttock, depending on the patient’s preference. The electrodes implanted were Specify 5-6-5 (Medtronic Inc., Minneapolis, MN, USA), and Penta, Lamitrode 44 and Tripole 16C (St. Jude Medical, Austin, TX, USA).
Morphine milligram equivalent (MME) dose
Every patient included in this study had consumed analgesics including opioids. The various combinations of opioid drugs used were standardized using the MME dose. To obtain the MME, the doses of the various opioid drugs were converted to the equivalent dose of morphine, in milligrams [27]. The MME was calculated at the baseline and at the last follow-up.
Statistical analysis
For statistical analyses, SPSS Statistics (version 19; IBM Corporation, Armonk, NY, USA) was used. As the primary outcome, changes in the VAS score and the NPSI score between the baseline and the last follow-up were analyzed by a paired t-test. In this analysis, there are seven independent factors (six subscores in the NPSI and the VAS score), so that significance level was adjusted as ‘p<0.0071’ (Bonferroni correction). Additionally, to find the compatibility of the NPSI compared to the VAS, Spearman correlation analysis was performed between the VAS improvement and the NPSI improvement.
To verify reduction of opioid overuse, MME between the baseline and the last follow-up was compared using a paired ttest. Relations between reduction of MME dose and improvement in NPSI were examined using the Spearman test. Reduction quantity (mg) of the MME at the last follow-up was correlated to improvements in each NPSI subscores. Since there are the five dimensions of pain qualities as well as the time score, we had six independent variables in the NPSI. Therefore, the Bonferroni correction (significance level, p<0.0083) was used for this analysis to correct type I error that could be yielded by multiple comparisons.
For post-hoc tests, preoperative factors that might affect post-operative pain score were evaluated. Baseline characteristics (age, disease duration, lesions in the spinal cord, and the psychiatric examinations) were correlated to improvements in pain scores (the VAS and the NPSI) using the Spearman correlation analysis and the Mann-Whitney U test (significance level, p<0.001, Bonferroni correction).
RESULTS
At the last follow-up, the NPSI total score had also improved significantly (42% improvement, p=0.0002, paired t-test). The mean NPSI total score at the baseline was 63±24, and those at the last follow-up was 34±24. Within the NPSI categories, the most significant improvement was observed in the pain time (45% improvement, p=0.0002) and the deep pain scores (58% improvement, p=0.001) (Table 2). Even though the p-values were less than the significance level (p<0.0083) defined in this study, the other pain categories showed clear improvement after implantation of SCS.

The VAS score had improved significantly (40%, p<0.001, paired t-test). The mean baseline and postoperative VAS score were 9.4±0.8 and 5.6±2.0, respectively. The VAS score was significantly correlated to the NPSI total score (r=0.667, p=0.003, Spearman correlation). Among subscores of the NPSI, only time score improvement was significantly correlated to the VAS score improvement (Fig. 1A, r=0.668, p=0.002, Spearman correlation). Other pain characteristics were not correlated to the VAS score improvements (Fig. 1B-F).

Correlation analysis between the Visual analogue scale (VAS) and the Neuropathic Pain Symptom Inventory (NPSI). The change of VAS score after the surgery was correlated to the change of the NPSI score. It shows that the improvement of VAS score was significantly correlated to the improvement of the time score among the NPSI subscores (Spearman correlation, r=0.688, p=0.002). From top left to bottom right, each figure indicates correlation between VAS and improvement of time score (A), superficial pain (B), deep pain (C), paroxysmal pain (D), evoked pain (E), and dysesthesia (F), respectively. *Significant correlation was found between time score and VAS score improvements.
The improvement of the NPSI score after implantation of SCS was accompanied by a marked reduction in opioid intake. While the preoperative MME average was 104±85 mg per day, it reduced to 54±64 mg at the last follow-up evaluation (Fig. 2), which was shown to be statistically significant (p=0.002, pared t-test). Spearman correlation between reduction in the MME dose and improvement in the NPSI score showed a significant positive correlation between a reduction of the MME dose and an improvement in the deep pain score (Fig. 3C, r=0.767, p=0.001). In addition, improvement in the dysesthesia score was appeared to be positively related to MME reduction, which was not significant due to Bonferroni correction. (Fig. 3F, r=0.551, p=0.033). The other pain characteristics did not show significant correlation with the MME dose change (Fig. 3A, B, D, and E). In contrast to that, the VAS score improvement was not correlated to the MME dose reduction (r=0.262, p=0.346, Spearman correlation).
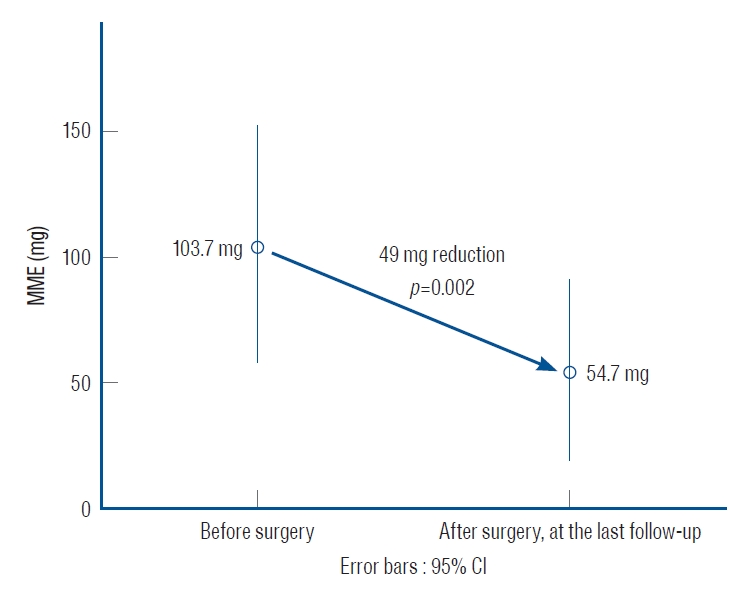
Change of morphine milligram equivalent (MME) dose before and after spinal cord stimulation (SCS). In the graph, a bar indicates 95% confidence interval (CI), and a circle in the center of bars indicates mean value of MME. MME dose before surgery (103.7 mg) was reduced after surgery (54.7 mg) examined at the last follow-up. This difference was statistically significant (t-test, p=0.002).
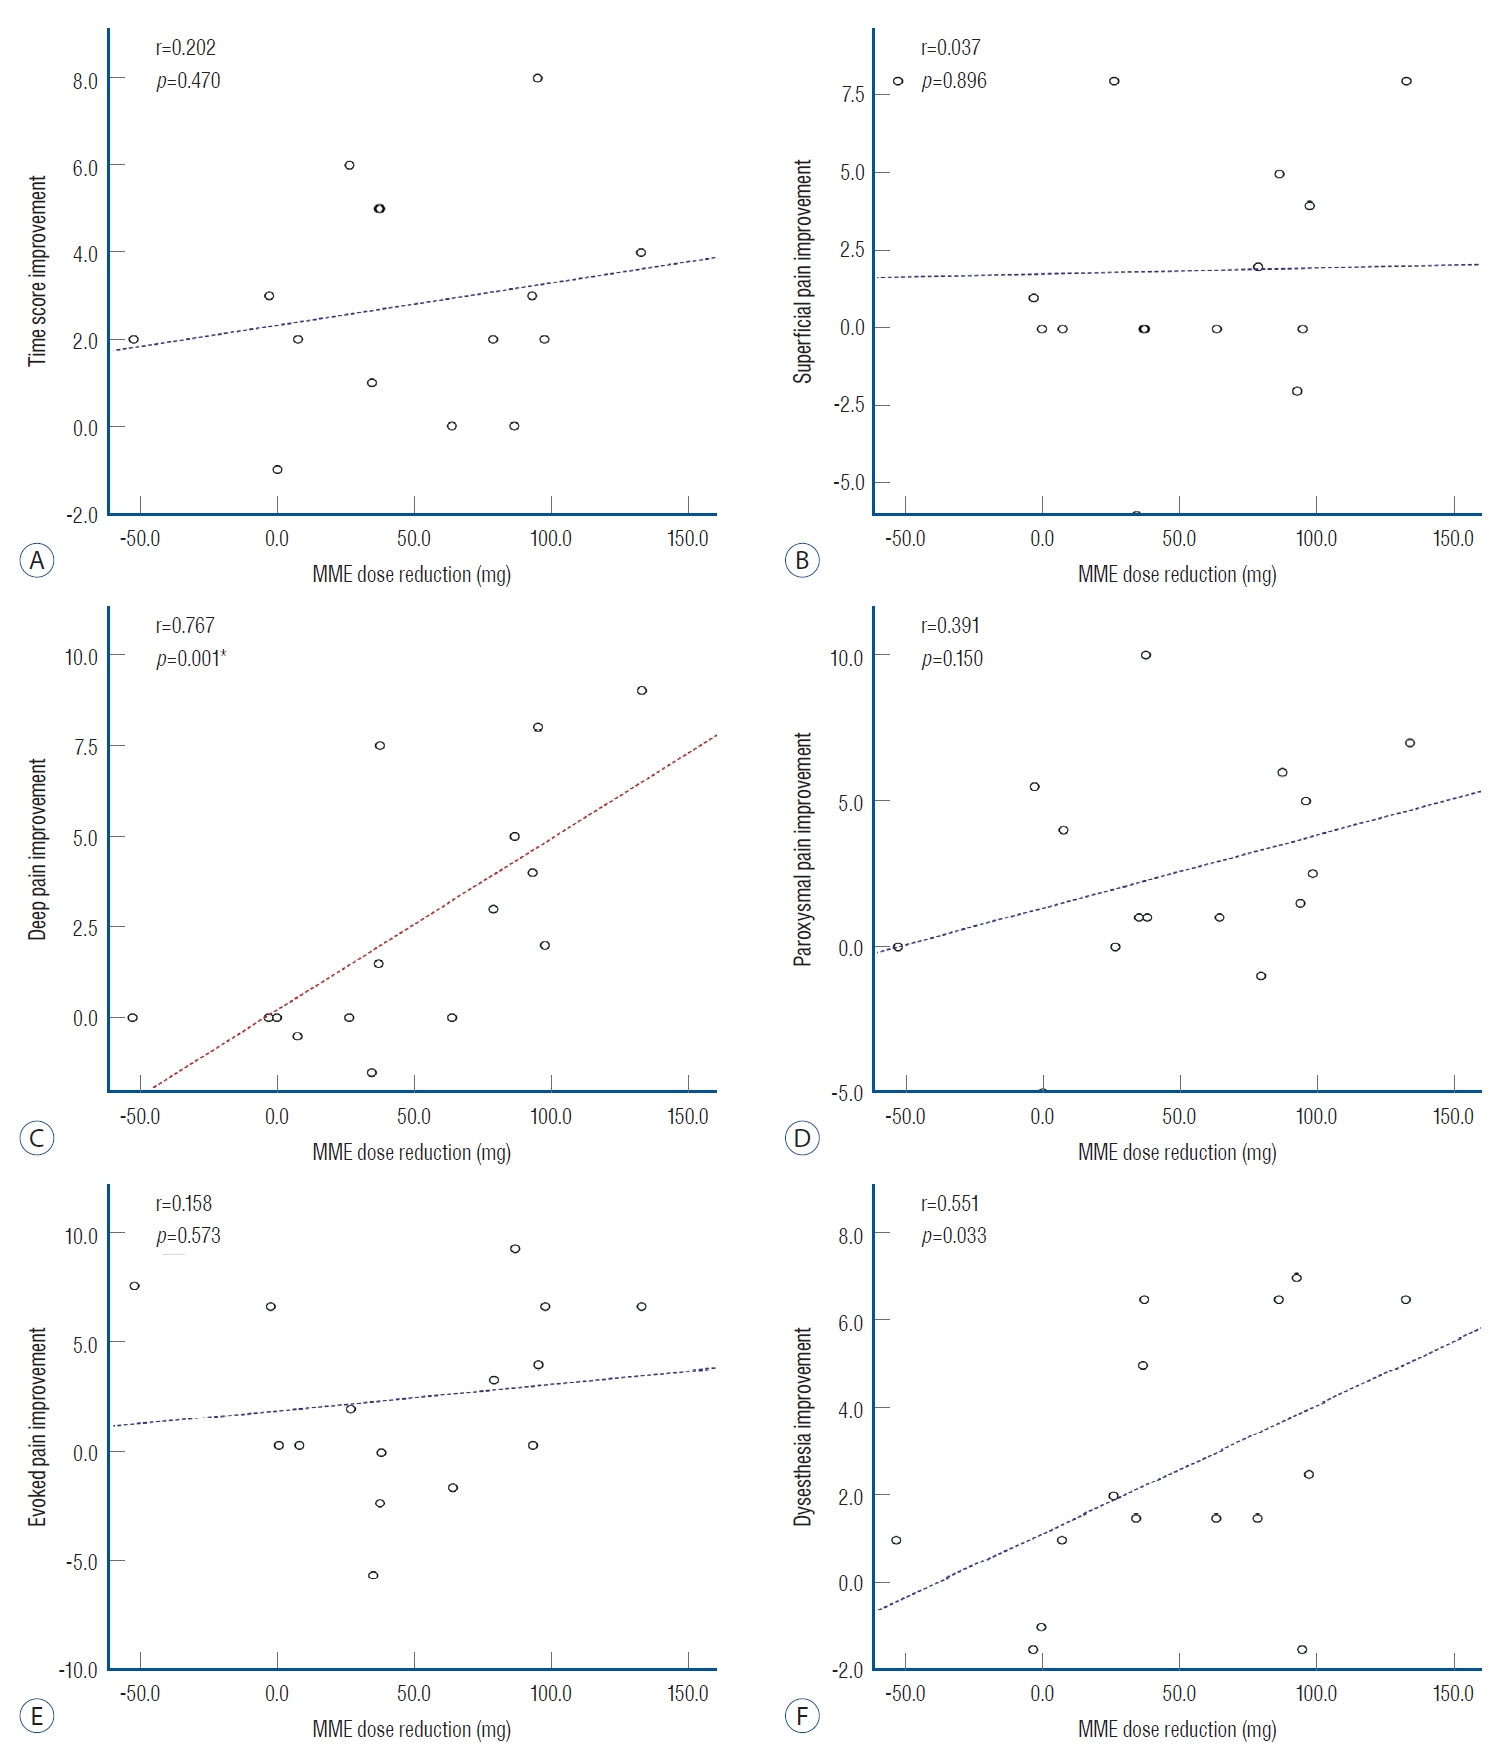
Correlation analysis between morphine milligram equivalent (MME) dose reduction and improvement of Neuropathic Pain Symptom Inventory (NPSI) score. Each graph is a scatter plot and regression line showing correlation between MME dose reduction and improvement of time score (A), superficial pain score (B), deep pain score (C), paroxysmal pain score (D), evoked pain score (E), and dysesthesia score (F). Only the deep pain score was shown to be significantly correlated to the MME dose reduction (Spearman correlation analysis, p=0.001). *Significant correlation was found between deep pain improvement and MME dose reduction.
In the post-hoc test, prognostic factors affecting better pain improvement were examined. Age, disease duration, PHQ-9, PHQ-15, and MMPI-2 were correlated to improvement of the pain scores. In this test, improvements in the VAS nor the NPSI subscores were not correlated to the age, disease duration, and the baseline psychiatric status (Spearman correlation, Table 3). However it is noteworthy that there were trends toward significance in some analyses, i.e., negative correlation between age and dysesthesia improvement, positive correlation between PHQ-9/PHQ-15 and VAS improvement. Average VAS improvement in patients with and without spinal cord signal change were 3±2 and 5±1, respectively (p=0.46, Mann-Whitney U test). Meanwhile, average NPSI total score improvement in patients with and without those were 13±12 and 18±15, respectively (p=0.423, Mann-Whitney U test). Additionally, differences in pain improvement between types of devices were also investigated, i.e., five column vs. two-three column, and St. Jude Medical device vs. Medtronic device, and no significant differences were found in this analysis.

Improvement patterns of the NPSI score were also visualized, in which prominent improvement was found in all patients at 3 months of follow-up after SCS (Fig. 4). Over time, this benefit was lost in some patients, while the other patients maintained improvement in the pain score until the last follow-up.
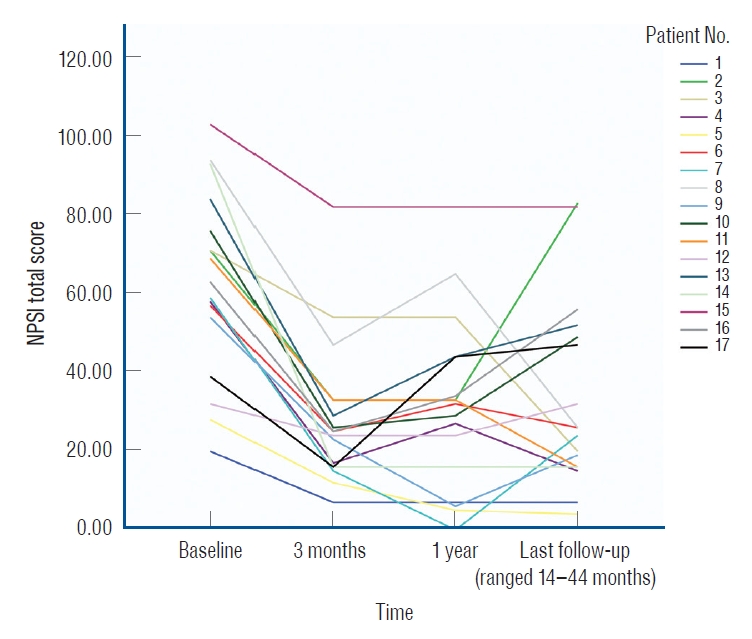
Sequential changes of the Neuropathic Pain Symptom Inventory (NPSI) score. This graph shows sequential changes of the total NPSI score in each patient. The most patient in the present study experienced prominent clinical improvement at the 3-months follow-up. These early prominent improvements were maintained throughout follow-up time in some patients (patient No. 1, 3, 4, 5, 6, 8, 11, 14, and 15). However, these initial improvements were partially lost over time in the other patients (patient No. 2, 7, 9, 10, 12, 13, 16, and 17).
Adverse effects
Patient 7 suffered a subcutaneous hematoma at the pulse generator implantation site. It was treated by a percutaneous needle aspiration. Spinal stenosis occurred in patient 3 and patient 16. They complained of loss of proprioception at 36 and 6 months after electrode implantations, respectively. The stenosis in both patients was due to the slow progression of degenerative changes compounded by the presence of the electrode. Decompressive spinal surgery was performed in both patients with leaving the electrodes in the original position and the neurological symptoms were resolved in both cases (Fig. 5).
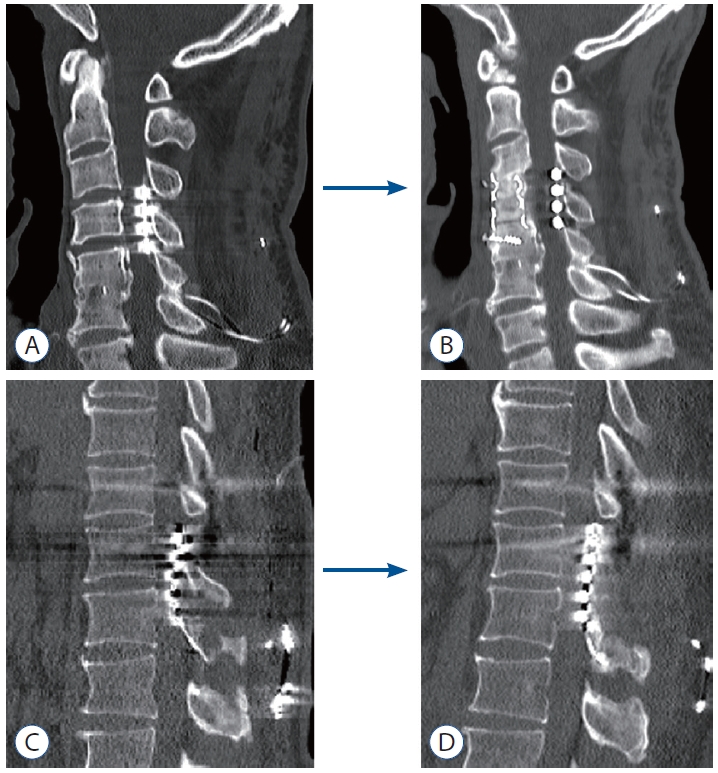
Sagittal computed tomography image of patients with device related complication. There were two patients whose spinal canal was stenosed due to mass effect of paddle-type electrode and pre-existing spinal stenosis. Patient 3 suffered from loss of proprioception 36 months after implantation of electrode (Penta; St. Jude Medical, Austin, TX, USA) at C3 to C5 level (A). Since patient 3 had gained significant benefits from spinal cord stimulation (SCS), he did not want to remove the device. Anterior interbody fusion with total corpectomy of C4 and partial corpectomy of C5 was performed (B), and his proprioception was recovered. Patient 17 had a loss of proprioception and low motor weakness 6 months after implantation of electrode (Specify 5-6-5; Medtronic Inc., Minneapolis, MN, USA) at T11–12 level (C). Because SCS give prominent pain relief to him, decompressive laminectomy was performed rather than device removal. Laminectomy at T10–12 level with removal of thickened ligamentum flavum was performed (D). After this surgery his proprioception was improved, and mild low motor weakness was improved.
DISCUSSION
This study assessed clinical outcome of paddle-type SCS using the NPSI score, and compared it to the VAS score, a conventional pain measurement. The most obvious difference of the NPSI apart from the VAS was fractionized assessment of pain symptoms. This fractionized assessment showed the other aspects of clinical outcome that was not identified by the VAS assessment. By evaluating the NPSI score, a substantial long-term benefit was found in pain time and deep pain scores after the surgery.
SCS has been considered a last resort for the treatment of intractable pain, including FBSS, CRPS and others pain disorders [11,17,28,38]. There are many scientific reports of the good outcomes of SCS [20,21,29,38,44]. It was shown that SCS provided superior pain relief, better functional capacity, and better cost-effectiveness than repeated spinal surgery and conservative management [20-22,29]. Many researchers have concluded that SCS provides long-term pain relief, and improves the quality of life and occupational activities [12,14,19,20,28,44].
However, there were also significant numbers of patient without sufficient pain relief despite well-functioning SCS devices. Several reasons have been suggested to explain this failure, which include preoperative usage of opioid medication and psychiatric comorbidity, but in some groups there were no methods to predict a good response on SCS [13,28,35]. There were losses of early benefits after SCS in 25–50% of patients, showing delayed loss of analgesia despite good initial effects [1,8,18,19,23]. The exact mechanism of this phenomenon is not well understood yet [1,19,20]. Age, duration of disease, presence of cord lesion, psychiatric status, and quality of pain did not predict the outcome.
Technical success of SCS is limited by unclear understanding of its mechanism and inaccurate measurement of its effect. Most patients with chronic neuropathic pain do not simply complain as “I am in pain.” Many expressions may be used such as “I feel a burning sensation in my arm,” “it feels like a pin prick in my shoulder,” or “a heavy load is pressing on my leg,” for describing their pain characteristics. A patient experiences pain when those sensations are accompanied by unpleasantness [2,3,9,33]. Sensory information of burning, pin pricking, and pressing are conducted via C-fiber, A-δ fiber, and A-β fiber in the somatosensory system, respectively. By means of quantitative sensory testing, SCS response of each of these heterogeneous sensory components are beginning to be elucidated [37]. But still, majority of articles describing the efficacy of SCS use monodimensional assessment system such as VAS score, which can oversimplify the result of SCS treatment. We attempted to avoid this error by adding NPSI, a diversified tool which separately evaluate different components of neuropathic pain.
Using NPSI, we found that spontaneous deep portion of neuropathic pain and total duration of pain were benefited from paddle-type SCS. Allodynia and hyperalgesia are regarded as a hypersensitivity of the sensory neuron caused by abnormally low threshold to external stimuli, which reflects in pathophysiologic alterations in the receptor level of the somatosensory system [3,9]. In contrast, spontaneous pain (superficial, deep and paroxysmal pain) and its duration (pain time) can be experienced independently of the external stimuli [3,4,9,33]. Therefore, this type of pain is kinds of actively constructed experiences, which can be considered to be generated by brain itself [3,5,6,43]. In this sense, it can be said that treatment with the SCS improved pain experienced at the brain level instead of reducing pain at the receptor level [43]. In this sense, it might be said that SCS reduced pain in the central nervous system more effectively than pain in the peripheral nervous system.
High consumption of opioid is known to be related to a reduced clinical effectiveness of SCS [34,40]. Although the exact mechanisms associated with opioid reduction and clinical effect of SCS is yet to be elucidated, theory of dysregulation of the opioid receptors of the reward system and pain modulatory system in the brain has been proposed to explain this issue [7,42]. The present study showed significant reduction in the opioid dose after surgery. Interestingly, opioid reduction also significantly correlated to the improvement of the deep pain score. Reduction in opioid use and an improvement of the deep pain score might indicate that effective SCS treatment affected a central modulatory pathway of pain in the brain [7,24,33].
This study has several limitations that should be considered. Our primary concern is the lack of validation of the Korean version of NPSI, which was used. NPSI was originally developed in France by Bouhassira et al. [5], and its validity in assessing neuropathic pain has been proved in other countries, such as the USA, Germany, Brazil, Japan, China, Finland, Italy, and Spain [10,34,41]. In those, Japan and China share many aspects of ethnicity and culture with Korea. Therefore, we suggested that NPSI could also be useful in the Korean population. However, this lack of validation should be borne in mind when interpreting this study. Second, the patient population in this study was heterogenous. The clinical effects of SCS on the different characteristics of neuropathic pain might vary in different groups of patients. Third, this is a retrospective study, so a causal relationship cannot be determined, and an additional selection bias might be present. Additionally, it would be better to address effects of the re-operation events described in the “adverse effects” section. In patient 3, the last NPSI follow-up was performed before the adverse event, and it seemed not to affect the outcome. In patient 16, the re-operation was conducted before last follow-up evaluation, and NPSI scores were worsen after re-operation, i.e., 20 points at the 3 months follow-up (before re-operation), and 51 points at the last follow-up (after re-operation).
CONCLUSION
The NPSI score can be a valuable tool for evaluating clinical outcome of SCS by providing additional perspective that has not been identified by other pain score. The deep pain score and pain time score were the most significantly improved components of neuropathic pain by SCS therapy, which might reflect how the SCS affects pain sensations in central nervous system.
Notes
CONFLICTS OF INTEREST
Soo-Bin Im has been editorial board of JKNS since November 2017 and Moonyoung Chung has been editorial board of JKNS since November 2017. They are not involved in the review process of this original article. No potential conflict of interest relevant to this article was reported.
INFORMED CONSENT
Informed consent was obtained from all individual participants included in this study.
AUTHOR CONTRIBUTIONS
Conceptualization : MC, RH
Data curation : JHH, SGK, MC
Formal analysis : JHH, MC
Funding acquisition : MC
Methodology : JHH, RH, SGK, SBI, JHJ, SCH, DSS, MC
Project administration : MC
Visualization : JHH, RH, BTK, MC
Writing - original draft : JHH
Writing - review & editing : SGK, SBI, JHJ, SCH, DSS, BTK, MC
Acknowledgements
This work was supported by the National Research Foundation of Korea (NRF) grant, funded by the Korean Ministry of Science and ICT (No. 2019R1G1A1100439). This work was also supported by the Soonchunhyang University Research Fund.
Supplementary materials
The online-only data supplement is available with this article at https://doi.org/10.3340/jkns.2021.0145.