Effect of Podophyllotoxin Conjugated Stearic Acid Grafted Chitosan Oligosaccharide Micelle on Human Glioma Cells
Article information

Abstract
Objective
To study the physiochemical characteristics of podophyllotoxin (PPT) conjugated stearic acid grafted chitosan oligosaccharide micelle (PPT-CSO-SA), and evaluate the ability of the potential antineoplastic effects against glioma cells.
Methods
PPT-CSO-SA was prepared by a dialysis method. The quality of PPT-CSO-SA including micellar size, zeta potential, drug encapsulation efficiency and drug release profiles was evaluated. Glioma cells were cultured and treated with PPT and PPT-CSO-SA. The ability of glioma cells to uptake PPT-CSO-SA was observed. The proliferation of glioma cells was determined by 3-[4, 5-dimethyl-2-thiazolyl]-2, 5-diphenyl-2H-tetrazolium bromide (MTT) assay. The apoptosis and morphology of U251 cells were observed by 4’,6-Diamidino-2-phenylindole dihydrochloride (DAPI) dye staining. Cell cycle analysis was performed by flow cytometry. The migration ability of U251 cells was determined by wound healing test.
Results
PPT-CSO-SA had nano-level particle size and sustained release property. The encapsulation efficiency of drug reached a high level. The cellular uptake percentage of PPT in glioma cells was lower than that of PPT-CSO-SA (p<0.05). The inhibitory effect of PPT-CSO-SA on glioma cells proliferation was significantly stronger than that of PPT (p<0.05). The morphologic change of apoptosis cell such as shrinkage, karyorrhexis and karyopyknosis were observed. The percentage of U251 cells in G2/M phase increased significantly in the PPT-CSO-SA group compared with PPT group (p<0.05). Compared with the PPT group, the cell migration ability of the PPT-CSO-SA group was significantly inhibited after 12 and 24 hours (p<0.05).
Conclusion
PPT-CSO-SA can effectively enhance the glioma cellular uptake of drugs, inhibit glioma cells proliferation and migration, induce G2/M phase arrest of them, and promote their apoptosis. It may be a promising anti-glioma nano-drug.
INTRODUCTION
The most common primary central nervous system tumours of adults are malignant gliomas [13]. Surgery combined with radiation and chemotherapy can improve survival rate and quality of life for patients, which is the standard treatment for malignant glioma [13,23,27]. Despite the development of these treatments, most malignant gliomas are incurable tumours, and are resistant to chemotherapeutic agents [4,13,26]. The average survival for patients with malignant gliomas was about 14 months from first diagnosis [4].
The natural podophyllotoxin (PPT) is mainly known for antiviral and antitumor properties [1,8]. Its antitumor property has been attributed to inhibit microtubule polymerization and depolymerization activities, which leads to mitosis failure and cell cycle arrest [3,21,22]. PPT is used as anticancer drug for lymphoma, leukemia, lung and testicular cancers, and it is also effective in treating neuroblastomas [6]. But its side effects including suppression of bone marrow, increased risk of secondary acute myelogenous leukemia and toxicity towards normal cells restrict their clinical application [5,14,16,19]. It is important for antitumor treatment to develop novel agents with better cytotoxic selectivity and fewer side effects. In the past decade, the new drug delivery systems for PPT including solid lipid nanoparticles have been developed to improve drug stability, water solubility and reduce drug side effects [20,24,28]. In recent years, chitosan oligosaccharide (CSO) can be regarded as a highly biocompatible, biodegradable, low immunogenicity, nontoxic material to build advanced drug delivery system [2,9]. Stearic acid (SA) grafted CSO (CSO-SA) was prepared by coupling reaction through carboxyl group of SA and the amino groups of CSO, Which can form nanoparticle with positive electrical charge in aqueous solution and enter the cancer cells [10,11,25]. So it has been used as a good drug delivery system for loading antineoplastic drug to improve the antineoplastic activity [10,11,25]. To reduce the side effects and improve the anticancer activity of PPT, we have developed PPT conjugated SA grafted CSO micelles (PPT-CSO-SA). Basing the physiochemical characteristics properties of PPT-CSO-SA, micellar size, zeta potential, entrapment efficiency, in vitro drug release profiles, in vitro anticancer activities against human glioma cells were studied in detail.
MATERIALS AND METHODS
Materials
The study was approved by the Institutional Review Board (IRB No. jiaxingeryuan20170720). PPT was purchased from the Mansite Pharmaceutical Co. Ltd. (Chengdu, China). Chitosan (Mw=450.0 K, 95% deacetylated degree) was supplied by Yuhuan Marine Biochemistry Co. Ltd. (Zhejiang, China). SA, 1-Ethyl-3-(3-dimethylaminopropyl) carbodiimide (EDC), 2,4,6-trinitrobenzene sulphonic acid (TNBS), and 3-[4, 5-dimethyl-2-thiazolyl]-2, 5-diphenyl-2H-tetrazolium bromide (MTT) reagent were supplied from Sigma (St. Louis, MO, USA). U87 cell, U251 cell, and fetal bovine serum (FBS) were supplied by the lisu-biotech Co, Ltd. (Shanghai, China).
Preparation of CSO
The 3% chitosan was obtained by putting 30 g chitosan into 1000 mL deionized water (DI water). Then 12.5 mL 36.5% (w/v) hydrochloric acid was added, the temperature was raised to 50°C, and chitosanase was added. The reactant was filtered through 0.45 µm Millipore filter, and the CSO was prepared by lyophilization.
Synthesis of CSO-SA
As reported previously [12], CSO-SA was synthesized by the EDC-mediated coupling reaction between amine groups of CSO and carboxyl group of SA. Briefly, CSO (0.15 g) was dissolved in 30 mL of DI water. Then SA (12 mg) in 15 mL ethanol was added. Finally, EDC (15 mg) was put in the compounds. The reaction solution was dialyzed by 20 mL ethanol for 24 hours, then throuth 20 mL distilled water using a dialysis membrane. The compounds were lyophilized, and CSO-SA was prepared. The degree of amino-substitution for CSO-SA was determined by TNBS method. Two millilitres of 0.1% aqueous TNBS solution and 2.0 mL 4% NaHCO3 were put into 2.0 mL CSO-SA with different concentrations. The mixture was analysed at 344 nm by a ultraviolet spectrophotometer.
Preparation of PPT-CSO-SA
In the first place, CSO-SA (10.0 mg) was added to DI water (3.0 mL). Then PPT with different feeding ratio was added. The acquired compounds were probe-type ultrasonicated 30 times in ice bath. The resulting product was dialysed using a dialysis membrane for 24 hours in order to remove ethanol, and then lyophilized. Finally, a series of PPT-CSO-SA solutions with various PPT concentration were prepared.
Characterization of CSO-SA and PPT-CSO-SA
The average particle size, zeta potential of the micelles with 1 mg/mL of CSO-SA (25% the substitute degree of amino groups) were examined by dynamic light scattering in deionized water.
Drug loading and encapsulation efficiencies of PPT-CSO-SA
Briefly, 0.1 mL PPT-CSO-SA was put into an ultrafiltration tube and centrifuged for 10 minutes. The concentration of PPT was examined by high-performance liquid chromatography (HPLC) method. The drug loading amount and the drug entrapment efficiency were calculated from Equations 1) and 2), respectively. 1) Drug loading = (the total feeding amount of PPT - the amount of PPT in filtrate) / the total amount of micelles × 100%. 2) Encapsulation efficiency = (the total feeding amount of PPT - the amount of PPT in filtrate) / the total amount of PPT × 100%.
In vitro drug release rate from the PPT-CSO-SA
PPT-CSO-SA was put into a dialysis bag, and the bag was added to a tube which contained phosphate buffer saline (PBS). The test was performed in shaking incubator, which was shaken at 100 rpm at 37°C. The amount of released drug was measured by HPLC with an emission wavelength of 292 nm. The drug release test was performed in triplicate.
Cell culture
U251 cell and U87 cell were maintained in dulbecco's modified eagle medium (DMEM) added with 10% FBS, 100 U/mL streptomycin and 100 U/mL penicillin at 37°C, 5% CO2. The cells were subcultured by trypsin/EDTA.
Cellular uptake of PPT
U251 cell and U87 cell were seeded in the 24-well plate respectively. PPT and PPT-CSO-SA with 10% PPT were put in, then the cells were continually incubated for 2, 4, 6, 8, 12, and 24 hours. The cells were washed three times with PBS (pH 7.4) and ready for cellular uptake trial. The cellular uptake was observed by HPLC.
MTT assay
U87 cell and U251 cells were exposed to various concentrations of free PPT, PPT-CSO-SA and CSO-SA micelles at 37°C for 24, 48, and 72 hours. The cytotoxicity was evaluated by MTT. About 20 µL of MTT was added and incubated for another 4 hours at 37°C at 5% CO2. Each well was washed to discard medium and then 150 µL of dimethyl sulfoxide (DMSO) was added. The absorbance of formazan product in each well was measured at 570 nm in a microplate reader. All the tests were performed in triplicate.
Observation of apoptosis of U251 cell
U251 cell was plated in 35 mL culture dish with 3.8×10⁴ cells/well, and incubated for 24 hours. Cells were then incubated with 20 µg/mL PPT-CSO-SA, 50 µg/mL PPT-CSO-SA, 50 ug/mL PPT and 0.1% DMSO fetal calf serum DMEM for 24 hours at 37°C. Cells were washed three times with PBS. Apoptosis induction effect was done by using 4’,6-Diamidino2-phenylindole dihydrochloride (DAPI) staining method.
Cell cycle analysis
U251 cells treated with different drug (20 µg/mL PPT and PPT-CSO-SA) for 24 hours were trypsinized and collected. Cells were washed with PBS for three times, placed in 70% ethanol, fixed at 4°C, and added with RNase A and propidium iodide. Cell cycle analysis was performed by flow cytometry.
Wound healing assay
Took cells and inculated them for 24 hours in a 24-well plate, then scratched the cells with a sterile pipette to form longitudinal scratches. PBS was used to wash the plate three times. After adding the drug (20 µg/mL PPT and PPT-CSO-SA), cells were incubated for 24 hours. scratched area were photographed 0, 12, and 24 hours after wounding. Five fields of view were taken for analysis in each group, and the experiment was repeated three times.
Statistical analysis
Quantitative data were expressed as mean±standard deviation of triplicate separate experiments, and statistical significance was tested by Student’s t-test or analysis of variance. In all tests, p<0.05 was considered significant.
RESULTS
Preparation of CSO-SA and PPT-CSO-SA
The CSO-SA was prepared by coupling reaction between amine groups of CSO and carboxyl group of SA according to the previous reports. CSO-SA with different substitute degree of amino groups was prepared by regulating the amounts of EDC and SA. Polymer micelles were formed by the self-assembly of amphiphilic block copolymers in aqueous media with nanometer size. The physicochemical characteristics of micelles were showed on Table 1. Table 2 showed the drug loading content and entrapment efficiency of PPT-CSO-SA with varied PPT-loaded amounts. 10% PPT-CSO-SA had highest drug entrapment efficiency which reached about 70%.

The physicochemical characteristics of micelles
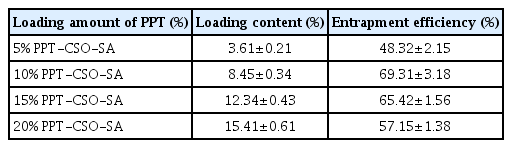
Loading content and entrapment efficiency of micelles
In vitro PPT release behaviors from PPT-CSO-SA
PPT release from PPT-CSO-SA micelles with different drug contents was showed in the Fig. 1. PPT release from PPT-CSO-SA was sustained.
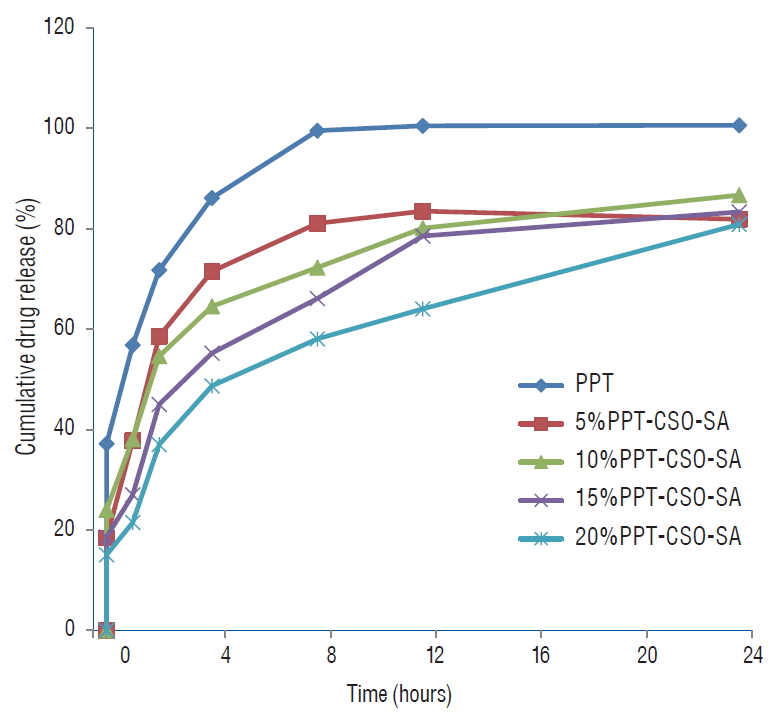
Drug release profiles from 5%, 10%, 15%, and 20% PPT-CSO-SA in PBS (pH 7.4) solution. PPT : podophyllotoxin, CSO : chitosan oligosaccharide, SA : stearic acid.
Cellular uptake assay
Fig. 2 showed that cellular uptake percentages of PPT in glioma cells was lower than that of PPT-CSO-SA, and U87 cell uptake efficiency of PPT-CSO-SA was higher than U251 cell. It was significant difference (p<0.05).

Cellular uptake percentages of PPT and PPT-CSO-SA in different glioma cells against incubation time : (A) U251, (B) U87. Cellular uptake percentage of PPT in PPT-CSO-SA by U251, U87 cells within different incubation time (C). PPT : podophyllotoxin, CSO : chitosan oligosaccharide, SA : stearic acid.
In vitro antitumor activities of micelles
In vitro assay of micelles, we used CSO-SA (25% the substitute degree of amino groups) as the carrier. In vitro cytotoxicity of PPT-CSO-SA was evaluated by MTT method. Table 3 showed the 50% inhibition concentration (IC50) of the CSO-SA, PPT, PPT-CSO-SA against U251 cell and U87 cell. Table 4 showed the cell inhibition rate of the different drug concentration. In contrast to PPT, PPT-CSO-SA had higher cytotoxicities against glioma cells (p<0.05).

IC50 values of CSO-SA, PPT and PPT-CSO-SA against U251 cells and U87 cells

Cell inhibition rate of PPT and PPT-CSO-SA against U251 cells and U87 cells
Apoptosis inductive effect
Apoptosis inductive effect of PPT-CSO-SA against glioma cells could be observed by DAPI dye staining. Fig 3 showed the morphologic change of apoptosis cell such as shrinkage, karyorrhexis and karyopyknosis by laser confocal microscope.
Effects of PPT-CSO-SA on cell cycle distribution in U251 cells
Table 5 showed that the percentage of U251 cells in G2/M phase increased significantly in the PPT-CSO-SA group compared with the control group and the PPT group (p<0.05). It indicated that PPT-CSO-SA could induce G2/M phase arrest of glioma cells.
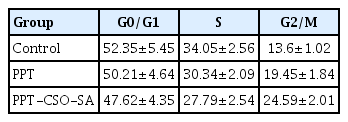
The effects of PPT and PPT-CSO-SA on cell cycle of U251 cells
Wound healing assay to detect cell migration ability
As showed in Table 6 and Fig. 4, compared with the PPT group, the cell migration ability of the PPT-CSO-SA group was significantly inhibited after 12 and 24 hours (p<0.05).
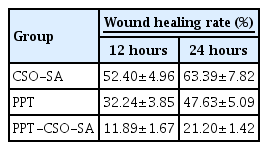
Wound healing rate of PPT and PPT-CSO-SA against U251 cells
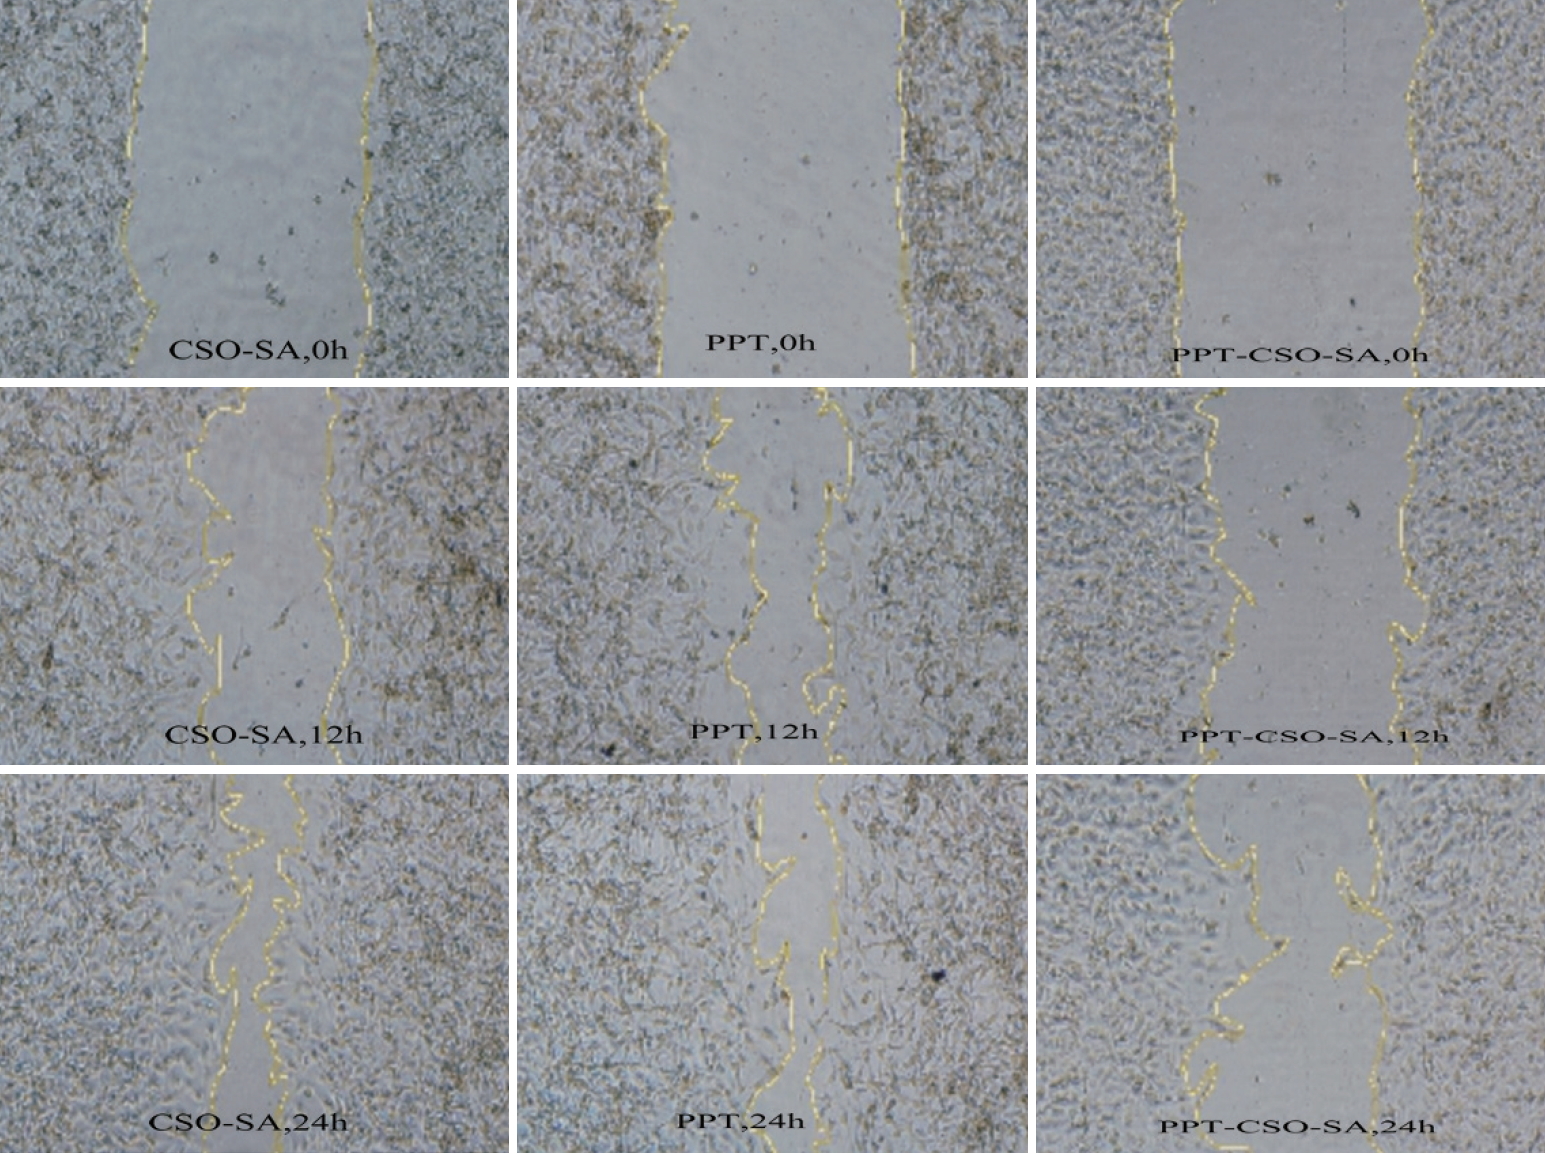
Compared with the PPT group, the cell migration ability of the PPT-CSO-SA group was significantly inhibited after 12 and 24 hours. PPT : podophyllotoxin, CSO : chitosan oligosaccharide, SA : stearic acid.
DISSCUSION
Malignant gliomas are the most aggressive brain tumors [17]. PPT is effective in treating neuroblastomas [6]. But its side effect limits the clinical application. In oder to reduce PPT side effects and improve its efficiency of antitumor activities, we develop the PPT-CSO-SA.
The nanoparticle size is very significant for the drug delivery system due to the enhanced permeability and retention effect [15]. Owing to this effect, the micelles can target and be largely accumulated to tumor tissue, which can reduce side effects and improve drug effciency [12]. CSO-SA has very small size, hydrophilic surface. These characteristics contributed to a prolonged circulation and could evade the mononuclear phagocyte system [7,12,18]. Its molecular target of drug was present in the tumour cells [12]. CSO-SA could self-assemble to form nanoscale micelles in aqueous solution [9,11]. Because of highly hydrophobic nature of PPT, after the PPT was loaded the CSO-SA, the majority of drugs were located in the cores of micelles. The micelles could greatly improve the water solubility of insoluble drugs.
The particle size of PPT-CSO-SA was in the range of 30.8–48.3 nm. The decrease of micelle size after loading is mainly due to the increase of hydrophobicity of CSO-SA. When PPT-loaded increased, the particle size increased a little. Zave size of PPT-CSO-SA had similar trends which ranged from 338.9 nm to 389.7 nm. Zeta potentials of micelles decreased in comparison with CSO-SA when PPT was loaded to CSO-SA. With the increase of the PPT-loaded, the particle size gradually increases, and the surface charge also gradually increases with the increase of the dose. The reason is that drug loaded could decrease the surface charge density.
Release of the drug from micelles is important for the drug delivery system. In this study, PPT is highly hydrophobic and forms attraction with the inner core of the micelles. The free PPT was released mostly within 4 hours, however, the release of PPT-CSO-SA ranged from 48.69% to 71.50% at the same time. Therefore PPT release from micelles was sustained. Fig. 1 showed that the more PPT content was, the slower the release speed was. The slowest release was 20% PPT-CSO-SA, the fastest release was 5% PPT-CSO-SA. The slower release of the PPT-CSO-SA was chiefly due to the hydrophobic interaction between CSO-SA and PPT. In addition, micelle release is related to particle size. Because the particle size is an important factor to influence its surface area. The larger its contacting area with the medium is, the faster its drug release of the micelles is [9]. With the increasing of drug loaded, the size of micelles rose, the surface area decreased, and release of the drug slowed.
Fig. 2 showed cellular uptake of PPT-CSO-SA was above that of PPT against different glioma cells in different incubation time. In vitro assay, we found that PPT-CSO-SA was higher cytotoxicities against glioma cells compared with PPT. It was probably due to the increased cellular uptake quantity of PPT in glioma cells. The result meant that PPT-CSO-SA had greater ability of internalization and could deliver more PPT into glioma cells. With the increasing of PPT-CSO-SA, the glioma cell inhibition rate increased. It was in accord with the cytotoxicity. Tables 5 and 6, Figs. 3 and 4 showed PPT-CSO-SA could induce G2/M phase arrest of glioma cells, inhibit U251 cell migration and promote their apoptosis, which was one of the reasons why PPT-CSO-SA could treat gliomas.
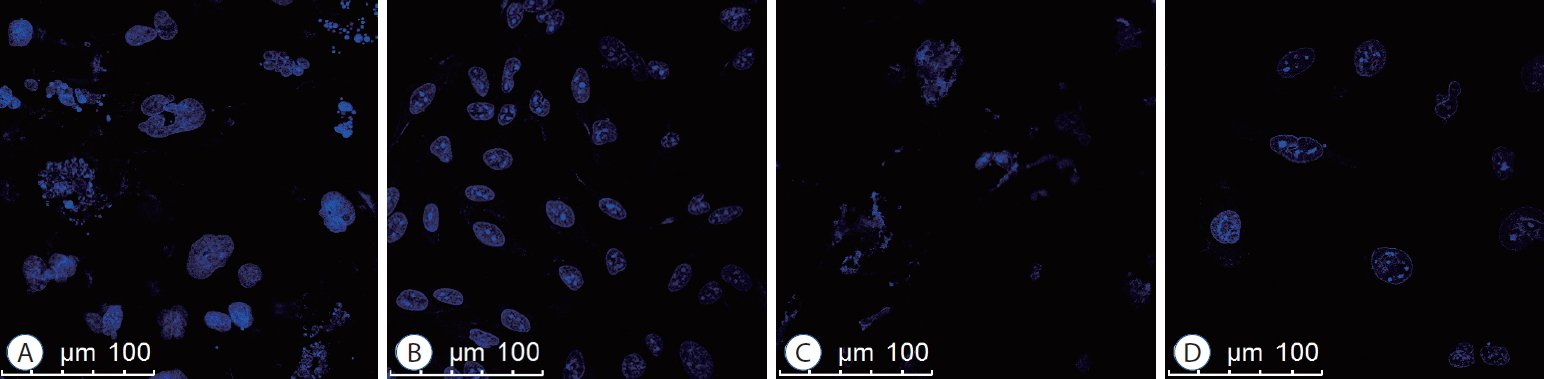
Apoptosis of U251 cells induced by PPT-CSO-SA (A : DMSO was used as control; B and C : 20 ug/mL and 50 ug/mL PPT-CSO-SA; D : 50 ug/mL PPT). PPT : podophyllotoxin, CSO : chitosan oligosaccharide, SA : stearic acid.
CONCLUSION
We successfully prepared PPT-CSO-SA in this study. The polymeric micelles were in the range of 30.8–48.3 nm and had the sustained release behavior. The drug entrapment efficiency reached up to 69.31%. The PPT-CSO-SA was more effective to suppress glioma cells than free PPT. The reason was that PPT-CSO-SA could enhance the glioma cellular uptake of drugs, inhibit glioma cells proliferation and migration, induce G2/M phase arrest of them, and promote their apoptosis. In a word, the PPT-CSO-SA could be considered as one of the promising anti-glioma nano-drugs.
Notes
No potential conflict of interest relevant to this article was reported.
INFORMED CONSENT
This type of study does not require informed consent.
AUTHOR CONTRIBUTIONS
Conceptualization : GHW, HPS, CSJ
Data curation : XH, XHJ
Formal analysis : ZMC
Funding acquisition : GHW
Methodology : HPS, XH
Project administration : GHW
Writing - original draft : GHW
Writing - review & editing : HPS
Acknowledgements
This study was supported by Social Development Project of Zhejiang Public Welfare Technology Research (LGF19H160013) and Zhejiang provincial medical science and technology program (2013KYA199).