Predictive Values of Magnetic Resonance Imaging Features for Tracheostomy in Traumatic Cervical Spinal Cord Injury
Article information
Abstract
Objective
To evaluate the magnetic resonance (MR) imaging features that have a statistically significant association with the need for a tracheostomy in patients with cervical spinal cord injury (SCI) during the acute stage of injury.
Methods
This study retrospectively reviewed the clinical data of 130 patients with cervical SCI. We analyzed the factors believed to increase the risk of requiring a tracheostomy, including the severity of SCI, the level of injury as determined by radiological assessment, three quantitative MR imaging parameters, and eleven qualitative MR imaging parameters.
Results
Significant differences between the non-tracheostomy and tracheostomy groups were determined by the following five factors on multivariate analysis : complete SCI (p=0.007), the radiological level of C5 and above (p=0.038), maximum canal compromise (MCC) (p=0.010), lesion length (p=0.022), and osteophyte formation (p=0.015). For the MCC, the cut-off value was 46%, and the risk of requiring a tracheostomy was three times higher at an interval between 50–60% and ten times higher between 60–70%. For lesion length, the cut-off value was 20 mm, and the risk of requiring a tracheostomy was two times higher at an interval between 20–30 mm and fourteen times higher between 40–50 mm.
Conclusion
The American Spinal Injury Association grade A, a radiological injury level of C5 and above, an MCC ≥50%, a lesion length ≥20 mm, and osteophyte formation at the level of injury were considered to be predictive values for requiring tracheostomy intervention in patients with cervical SCI.
INTRODUCTION
Traumatic cervical spinal cord injury (SCI) may cause paralysis of the muscles that are innervated by the segments of the spinal cord caudal to the injury. For example, paralysis of both the diaphragm and accessory muscles of respiration may occur in patients with an SCI [7,26]. These complications to respiration remain a major cause of morbidity and mortality in patients with a cervical SCI [12], and may lead to the need for mechanical ventilation [2,6,7,13,22,27].
Magnetic resonance (MR) imaging plays a crucial role in detecting and evaluating spinal trauma. Subtle bone marrow, soft-tissue, and spinal cord abnormalities, which may not be observed using other imaging modalities, can be readily detected using MR imaging. For example, the extrinsic compression of the spinal cord and the internal architecture of the spinal cord are best visualized with MR imaging [19,20].
Several authors have investigated the risk factors associated with requiring a tracheostomy in patients with a traumatic cervical SCI [3,6,7,13,22,25,27]. Some of these risk factors include neurological severity, the neurological level of injury, pre-existing medical comorbidities, forced vital capacity, etc. However, to the best of our knowledge, no studies have examined predictive values associated with requiring a tracheostomy using the MR imaging findings from patients with cervical SCI. The purpose of this study was to identify meaningful findings that can be used as predictive values for requiring a tracheostomy in patients with cervical SCI by analyzing MR images.
MATERIALS AND METHODS
Patient selection
We retrospectively analyzed patients with cervical SCI admitted to our institution between January 2005 and December 2015. Patients with a concomitant head injury, a Glasgow coma scale score lower than 15, a cervical spinal cord injury caused by disease, and combined injuries that affect respiration (e.g., pulmonary contusions) were excluded. Medical records and discharge summaries were individually reviewed.
Management
Intubation was performed in patients with low oxygen saturation due to weakened respiration at admission; mechanical ventilation was also used in patients with low oxygen saturation during hospitalization. Extubation was performed in those patients who recovered and were able to breathe independently. Tracheostomy was performed in patients who required continuous mechanical ventilation.
Data analysis
Our review of medical records included patient demographics (age, sex), the American Spinal Injury Association (ASIA) classification at admission, the placement of a tracheostomy, and the mechanism of injury. The ASIA impairment scale was used by a neurosurgeon on the first day of admission to categorize patients into ASIA grade A, B, C, D, or E.
MR imaging analysis
The radiological findings related to cervical SCI were analyzed using MR images, and the MR scan was obtained within 24–48 hours after the injury. The following imaging procedures were performed according to our protocol for spinal trauma : T1-weighted, T2-weighted, and fat-suppressed T2-weighted fast spin-echo imaging sequences. The analyzed MR imaging findings included the radiological level of injury, as well as quantitative and qualitative results.
The radiological level of injury was identified as the level of maximum cord compression depicted on MR images, the level of underlying ligamentous soft tissue, or osseous injury in patients without radiologic evidence of cord compression. The presence of a change in cord signal intensity was also used to help identify the level of SCI [19]. The radiological level of injury was analyzed by dividing it into upper and lower levels (upper level, C5 and above; lower level, C5–C6 intervertebral disc and below) because several studies have suggested that a neurological level of C5 and above is a risk factor for requiring a tracheostomy [6,7,25,27].
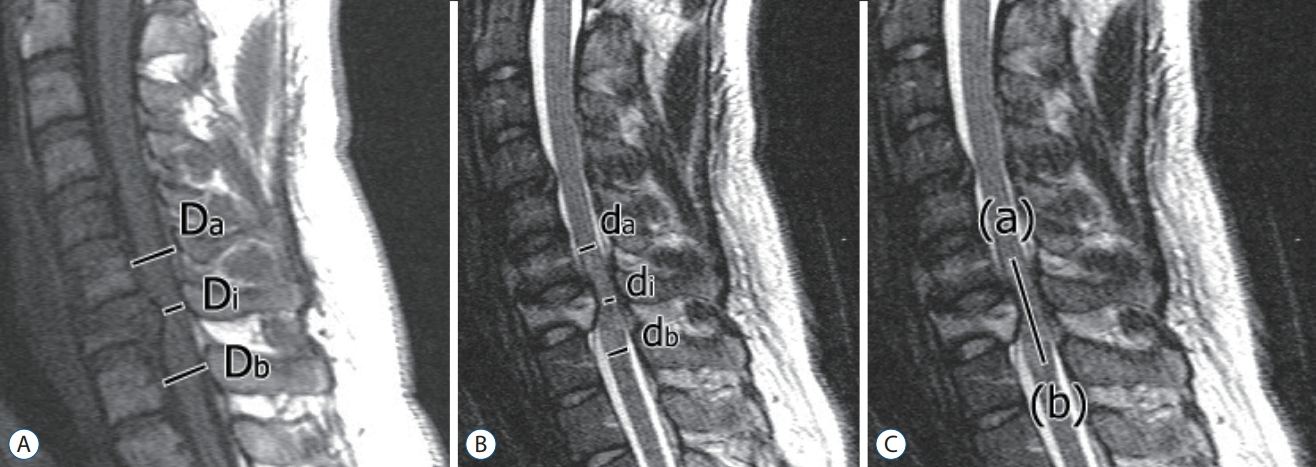
The quantitative findings included the following three parameters suggested by Fehlings et al. [9] : maximum canal compromise (MCC), maximum spinal cord compression (MSCC), and lesion length. Mid-sagittal T1-weighted MR images were used to determine the MCC, and T2-weighted MR images were used to determine the MSCC and lesion length. For measurement of MCC, the anteroposterior canal diameter on midsagittal and axial images at the level of maximum compromise was compared with the anteroposterior canal diameter at the normal levels immediately above and below the level of injury. Measurements of the normal canal anteroposterior diameter were taken at mid-vertebral body levels. For measurement of MSCC, the anteroposterior cord diameter on midsagittal and axial images at the level of maximum compression was compared with the anteroposterior cord diameter at the normal levels immediately above and below the level of injury. If cord edema was present, measurements of normal anteroposterior cord diameter were made at mid-vertebral body levels just beyond the rostral and caudal extent of the cord edema at the levels where the cord appeared normal (Fig. 1). Qualitative parameters were determined based on the potential prognostic factors for cervical SCI and radiologic findings related to traumatic cervical SCI. These parameters were as follows : cord swelling, cord edema, cord contusion, intramedullary hemorrhage, soft-tissue injury, disc herniation, osteophyte, ossification of posterior longitudinal ligament (OPLL), burst fracture, fracture and dislocation, and prevertebral hematoma. Cord swelling, cord edema, and cord contusion were defined on the basis of MR imaging features described by Ramón et al. [21] and Mahmood et al. [17] (Table 1). Fatsuppressed T2-weighted fast spin-echo images were used to enhance the visualization of ligaments and soft-tissue injury.

Measurement of maximum canal compromise, maximum spinal cord compression, and lesion length. Midsagittal (A) T1-weighted and (B and C) T2-weighted MR images obtained in a 44-year-old man with acute traumatic cervical spinal cord injury. A : Maximum canal
Statistical analysis
Continuous data (e.g., age) were presented as medians and interquartile ranges. Categorical data (e.g., sex) were presented using frequencies and percentages. The relationship between predictive factors and tracheostomy placement in patients with cervical SCI was analyzed using univariate and multivariate methods. For the univariate analysis, continuous variables (MCC, MSCC, and lesion length) were compared using the Mann-Whitney U-test and categorical variables (severity of SCI, radiological level of injury, cord swelling, cord edema, cord contusion, intramedullary hemorrhage, soft-tissue injury, disc herniation, osteophyte, OPLL, burst fracture, fracture and dislocation, and prevertebral hematoma) were compared using the Fisher’s exact or Pearson’s chi-square test. For parameters shown to have a p-value less than 0.2 on univariate analysis, multivariate analysis was carried out using logistic regression. For continuous variables showing a significant value on multivariate analysis, the interval likelihood ratio was calculated and the receiver operating characteristic (ROC) curve analysis was performed to determine the cut-off value for the positive findings. All tests were performed by using α=0.05, and the SPSS for Windows version 23.0 statistical package (SPSS, Inc., Chicago, IL, USA) and the MedCalc for Windows version 17.0.4 (MedCalc Software, Mariakerke, Belgium) were used for all analyses.
RESULTS
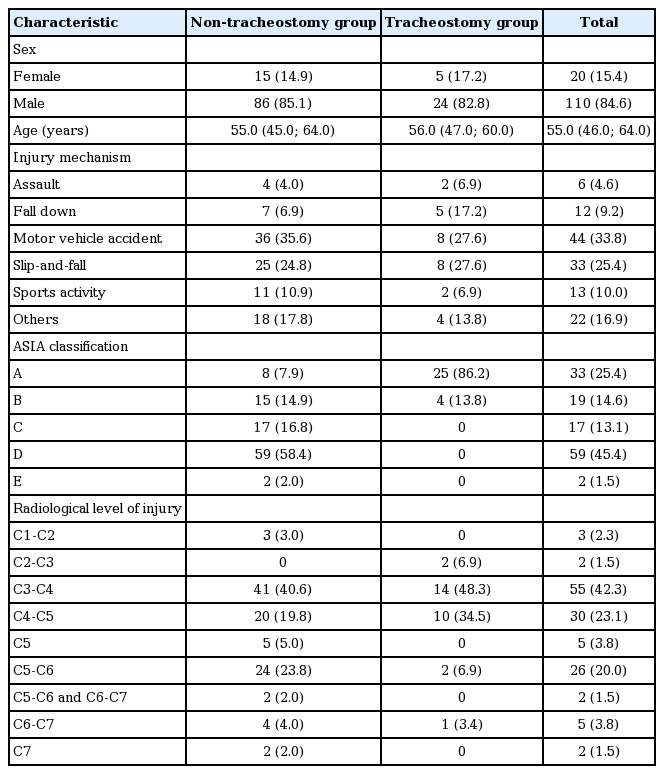
During the 11-year study period, 130 patients (20 females and 110 males) with cervical SCI were identified and divided into two groups (non-tracheostomy group, 101; tracheostomy group, 29). The patients with cervical SCI ranged from 16 to 81 years of age (median age, 55.0 years). Regarding injury mechanism, motor vehicle accidents (33.8%) were the most common, followed by slip-and-fall (25.4%) (Table 2).
Neurological status
The neurological status at admission revealed that ASIA grade D (58.4%) was the most common in the non-tracheostomy group, while ASIA grade A (86.2%) was the most common in the tracheostomy group (Table 2). For severity of SCI, ASIA grade A was 7.9% in the non-tracheostomy group but 86.2% in the tracheostomy group, and there was a significant difference between both groups (p<0.001) (Table 3). Multivariate analysis revealed a significant difference between both groups (p=0.007, adjusted odds ratio [OR]=24.750) (Table 4).
Radiological level of injury
Of the total patients, injury was sustained to the C3–C4 (42.3%) and C4–C5 (23.1%) vertebral levels (Table 2). Furthermore, injury was observed more in the upper level versus lower level in both groups (non-tracheostomy group, 68.3%; tracheostomy group, 89.7%), but it was significantly more in the tracheostomy group (p=0.041) (Table 3). Also, there was a significant difference between both groups (p=0.038, adjusted OR=25.830) as determined by multivariate analysis (Table 4).
Quantitative MR imaging variables
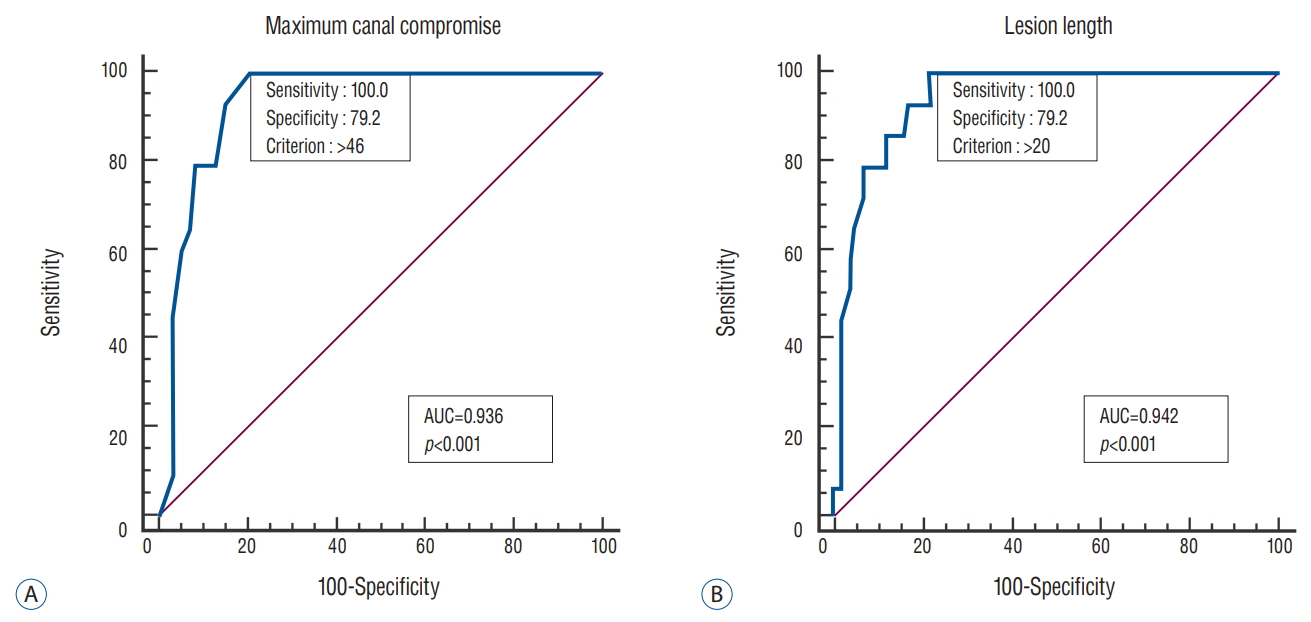
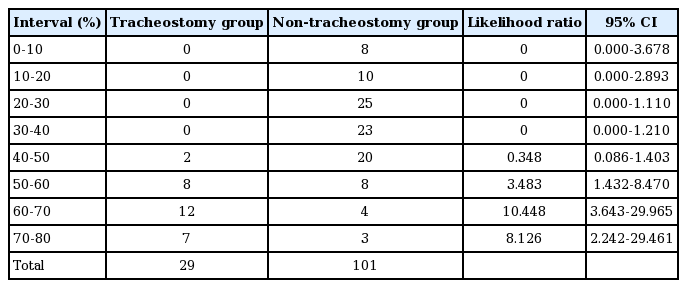
Three variables (MCC, MSCC, and lesion length) were evaluated as the factors of quantitative MR imaging; univariate analysis determined that there were significant differences between both groups (MCC, p<0.001; MSCC, p<0.001; lesion length, p<0.001) (Table 3). On multivariate analysis, there was a significant difference between both groups in MCC and lesion length (MCC, p=0.010, adjusted OR=1.140; lesion length, p=0.022, adjusted OR=1.097), but no significant difference in MSCC was observed (p=0.473) (Table 4). To determine the cut-off values for positive findings, an interval likelihood ratio and ROC curve analysis were performed for MCC and lesion length. The likelihood ratio of MCC was 0.348 at an interval of 40–50%, but 3.483 at an interval of 50–60%. The highest likelihood ratio was 10.448 at an interval of 60–70% (Table 5). For the ROC curve of MCC, the area under the curve (AUC) was 0.936 and the cut-off value indicated by the Youden index was 46% (Fig. 2A). The likelihood ratio for lesion length was 2.090 at an interval of 20–30 mm, with its highest value of 13.931 at an interval of 40–50 mm. (Table 6). For the ROC curve of lesion length, the AUC was 0.942, and cut-off value was 20 mm (Fig. 2B).

Receiver operating characteristic curve. A : Maximum canal compromise. B : Lesion length. AUC : area under the receiver operating characteristic curve.
Qualitative MR imaging variables
On univariate analysis, we determined that there were significant differences between both groups as follows : cord contusion (p<0.001), intramedullary hemorrhage (p<0.001), soft-tissue injury (p<0.001), osteophyte (p=0.027), fracture and dislocation (p<0.001), and prevertebral hematoma (p=0.021) (Table 3). However, on multivariate analysis, there was a significant difference in osteophytes between both groups (p=0.015, adjusted OR=28.553) (Table 4).
DISCUSSION
Traumatic cervical SCI may cause dysfunctions and complications in several organs [10,24]. Of these, respiratory complications that may lead to the need for mechanical ventilation remain a major cause of morbidity and mortality in patients with cervical SCI [12].
Inspiration involves the contraction of the diaphragm and internal intercostal muscle, which allow the chest wall to expand. The accessory muscles are recruited to aid in this process at high levels of activity. Expiration is mostly passive but can be augmented in this process by the abdominal musculature. The diaphragm is innervated by C3–C5, and a SCI above this level will result in the need for immediate mechanical ventilation. Even if this segment is preserved, any cervical SCI will lead to a substantial compromise in ventilation because of the paralysis of the intercostal muscles. This will result in chest wall contraction with inspiration. Also, forced expiration will also be compromised because of the paralysis of the abdominal musculature [1]. This will also result in a decreased ability to cough and to clear secretions, which may later lead to respiratory insufficiency [18].
MR imaging is the best tool for the diagnosis of cervical SCI and evaluation of the severity of the injury. Indeed, the extrinsic compression of the spinal cord and internal architecture of the spinal cord are best visualized using MR imaging. Several studies have shown the correlation between MR imaging findings and neurologic outcomes in patients with cervical SCI. These studies demonstrate the usefulness of MR imaging in patients with cervical SCI.
In this study, we focused on the findings of MR imaging performed in patients with traumatic cervical SCI, as well as the ability to visually evaluate aspects of cervical SCI. The severity of the injury, well known as a risk factor, was analyzed as a significant factor; four additional factors were analyzed as significant predictors associated with the findings of MR imaging including the radiological level of injury, MCC, lesion length, and osteophyte formation.
In this study, we identified the significant differences in the need for a tracheostomy between patients with radiological injuries to the level of C5 and above and to C5–C6 intervertebral disc and below. Previous studies have shown the relationship between the neurological level of injury and tracheostomy. Claxton et al. [6] showed that a neurological level of C5 and above and complete spinal cord lesions were predictors of the need for mechanical ventilation. Harrop et al. [13] observed that while 79% of patients with an injury at a neurological level of C5 and above received a tracheostomy, only 35% of those with an injury at a level of C6 and below received this intervention. The radiological level of injury may be the same as or slightly different from the neurological level; this is because the radiological level is the level of maximum cord compression observed in MR imaging while the neurological level is the level determined clinically as the most caudal segment of the cord with intact sensation and antigravity muscle function strength. Thus, the risk of requiring tracheostomy intervention should be considered in patients with injury at a level lower than C5, as well as in patients with SCI at the level of C5 and above with evaluation of other predictive factors such as the severity of the injury and lesion length.
We used an objective quantitative approach to assess the MR images obtained from patients with cervical SCI. The quantitative measurements of MSCC and MCC used in our study have been previously reported as objective, reliable, and standardized, with good inter- and intra-observer reliability [8,9]. In our study, MCC and lesion length were quantitative MR imaging findings that showed significant differences between the non-tracheostomy and tracheostomy groups.
The analysis of MCC showed that the risk of requiring a tracheostomy increased significantly when the MCC was 50% or greater, and the risk was about ten times higher at an MCC of 60% or greater. Similarly, the risk of requiring a tracheostomy increased significantly when lesion length was 20 mm or greater, and the risk was about fourteen times higher at a lesion length of 40 mm or greater. There have been no studies that investigate MCC or lesion length as risk factors for requiring a tracheostomy, but some studies have reported on the relationship between these values and neurological outcomes. Kang et al. [14] attempted to quantify canal compromise by using lateral cervical radiography; they observed that the anteroposterior diameter of the spinal canal was smaller in patients with complete and incomplete SCI compared with the diameter in neurologically healthy subjects. Miyanji et al. [19] used the same measurement method to determine the MCC and lesion length that we used in our study; they reported that the MCC and lesion length were more substantial in patients with complete SCI versus incomplete SCI and that the MCC was correlated with baseline ASIA motor scores. Both MCC and lesion length are quantitative MR imaging findings that reflect the aspect and severity of spinal cord injury; as such, these findings can be not only be used to evaluate neurological outcome but also to predict the risk of requiring a tracheostomy in patients with cervical SCI.
In our study, several qualitative MR imaging variables were evaluated. On univariate analysis, there were significant differences in cord contusion, intramedullary hemorrhage, softtissue injury, osteophyte formation, fracture and dislocation, and prevertebral hematoma between the non-tracheostomy and tracheostomy groups. In contrast, as determined by multivariate analysis (which corrected for the influences of several variables), there was a significant difference observed in osteophytes formation between the two groups. Schneider et al. [23] described that osteophyte formation impinging upon the anterior portion of the spinal canal results in a pinching or squeezing type of compression in hyperextension cervical SCI and that these arthritic spurs may play a vital role in acute SCI. Osteophytes can cause more damage to the spinal cord compared to other factors, such as herniated disc and thickened ligamentum f lavum, because they develop hard and sharp edges. This information on osteophyte formation does not fully explain the risk of requiring a tracheostomy. However, if MR imaging shows osteophyte formation at the level of injury in patients with cervical SCI, then it should be possible to identify the need for tracheostomy intervention.
There are several limitations to this study. First, it was a retrospective study. Second, although this was an extensive review over 11 years, the sample size was relatively small. Third, the effect of surgical treatment on tracheostomy was not considered. Although preoperative MR images were only evaluated in this study, surgical treatment, such as decompression, may influence on tracheostomy because it can eliminate the causes of cord compression. Therefore, to evaluate MR imaging features for tracheostomy considering surgical treatment, it is necessary to analyze not only preoperative images but also postoperative images. Fourth, this study reflected the experience of a single center. If the study was based on a large volume of data from multiple centers, then results that are more meaningful could have been obtained.
The benefits of early tracheostomy have been well-documented, and reports have shown a decrease in the incidence of pulmonary infections, a decrease in the incidence of laryngeal injury, shorter mean hospital and intensive care unit stay, a shorter duration of mechanical ventilation, and a lower cost of hospitalization [4,16]. We believe that early tracheostomy should be considered in patients with a high possibility of eventual tracheostomy, considering the patient’s condition and risk factors mentioned in this study.
Because most respiratory complications are caused by ventilatory failure and impaired clearance of airway secretions [15], it is important to minimize these complications and reduce mortality through pulmonary rehabilitation, which improves ventilation and clearance of airway secretions. Methods of pulmonary rehabilitation include respiratory muscle training, ventilator-assisted speech, and assisted coughing techniques, which are customized and implemented for each patient. Galeiras Vázquez et al. [11] reported that the conservative management of respiratory dysfunction in SCI patients can help in removal of airway secretions using various techniques, as well as improve ventilation through respiratory exercises and noninvasive positive air pressure support. Brown et al. [5] reported that respiratory muscle training in SCI patients improves vital capacity and alleviates symptoms such as dyspnea and weak cough. Therefore, pulmonary rehabilitation is essential as it helps minimize respiratory complications and reduces the need for tracheostomy in patients with cervical spinal cord injury.
CONCLUSION
The MR imaging findings in patients with cervical SCI can help not only to evaluate the severity of spinal cord injury but also to predict the need for a tracheostomy. The ASIA grade A classification, a radiological injury level of C5 and above, an MCC ≥50%, a lesion length ≥20 mm, and osteophyte formation at the level of injury were all considered to be predictive values for requiring tracheostomy intervention in patients with cervical SCI. Therefore, for patients at high risk of requiring a tracheostomy, active pulmonary rehabilitation should be performed. Further, early tracheostomy may be beneficial for these patients.
Notes
No potential conflict of interest relevant to this article was reported.
INFORMED CONSENT
Informed consent was obtained from all individual participants included in this study.


