Erratum to “Retrospective Analysis of Cerebrospinal Fluid Profiles in 228 Patients with Leptomeningeal Carcinomatosis : Differences According to the Sampling Site, Symptoms, and Systemic Factors” by Shim Y, et al. (J Korean Neurosurg Soc 59 : 570–576, 2016)
Article information
https://doi.org/10.3340/jkns.2016.59.6.570
In this article by Shim et al., the measurement unit of CSF cell count was given incorrectly. It should be “cells/mm3” instead of “cells/cm3”.
Corrected sentences are as follows;
Page 570 Results of abstract :
Cell counts (median : 8 vs. 1 cells/mm3) and protein levels (median : 68 vs. 17 mg/dL) significantly higher in lumbar CSF than in ventricular CSF (p<0.001).
Page 571 (right column), line 46–53 :
The mean total cell count in the lumbar CSF was 25.0 cells/mm3 (standard deviation : ±47.3; range : 0–310). The reference normal range was set at ≤5 cells/mm3. The distribution of the cell count had a leftward skew (median : 8 cells/mm3; third quartile : 25 cells/mm3) (Fig. 1A). The distribution of the cell counts in the ventricular CSF was also skewed (mean : 10.4 cells/mm3; standard deviation : ±44.2; range : 0–360; median : 1 cells/mm3; third quartile : 5 cells/mm3) (Fig. 1B).
Page 573 (left column) line 5 :
(median: 2 vs. 9 cells/mm3; p=0.046).
Page 574 (right column) line 1–2 :
the ventricular CSF (1 cell/mm3) was within the normal range and that 75% of the patients had ≤5 cells/mm3.
Page 574 Table 2 :
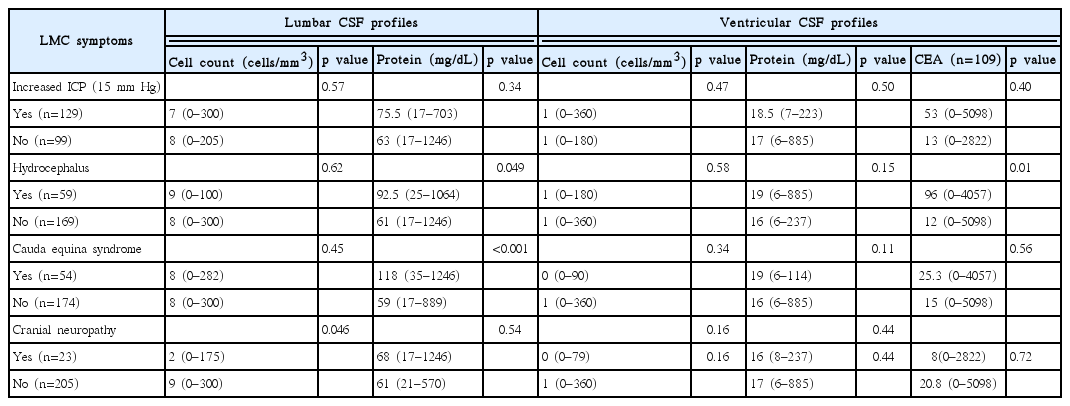
Lumbar and ventricular CSF profiles correlated with LMC symptoms (n=228)