Pre- and Post-Angioplasty Perfusion CT with Acetazolamide Challenge in Patients with Unilateral Cerebrovascular Stenotic Disease
Article information
Abstract
Objective
Perfusion computed tomography (PCT) has the ability to measure quantitative value and produce maps of mean transit time (MTT), cerebral blood flow (CBF), and cerebral blood volume (CBV). We assessed cerebral hemodynamics by using these parameters and acetazolamide (ACZ) challenge for pre- and post-procedural evaluation in patients with unilateral cerebrovascular stenotic disease.
Methods
Thirty patients underwent pre-procedural PCT with ACZ challenge, and 24 patients (80%) was conducted follow up PCT after angioplasty with same protocol. The mean MTT, CBF, and CBV were measured and compared in both middle cerebral arterial (MCA) territories before and after ACZ challenge. Hemispheric ratio and percent change after ACZ challenge were calculated before and after angioplasty.
Results
The mean stenosis rate was 76.6%. Significant increases in MTT (32.6%, p=0.000) and significant decreases in CBF (-14.2%, p=0.000) were found in stenotic side MCA territories. After ACZ challenge, there were significant changes in MTT (37.4%, p=0.000), CBF (-13.1%, p=0.000), and CBV (-10.5%, p=0.001) in pre-procedural perfusion study. However, no significant increases were found in MTT, or decreases in CBF and CBV in post-procedural study. There were no significant changes after ACZ challenge also. In addition, the degrees of these changes (before and after ACZ challenge) were highly correlated with the stenotic degrees in pre-procedural perfusion study.
Conclusion
PCT with ACZ challenge appears to be a useful tool to assess the cerebral perfusion status especially in patients with unilateral symptomatic stenotic disease.
INTRODUCTION
Until recently, the cerebrovascular stenosis has been treated mainly medically, and the endovascular treatment such as stent-angioplasty has been controversial and criticized primarily due to limited evidence and lack of prospective and controlled trials, especially for intracranial stenosis6). Clearly, the periprocedural risks are pretty considerable2,6). Even though, the periprocedural morbidity and mortality might be expected to diminish with technical advances and accumulation of clinical experience, the indication of revascularization surgery such as stent-angioplasty should be very limited at the present time11,19,20). Undoubtedly, the cerebral arterial stenosis with sufficient collaterals and without clinical symptoms has been hardly regarded as the target of surgical or endovascular intervention. Because the degree of the stenosis itself can not reflect accurate regional cerebral hemodynamics, confirmation of the substantial decrease of regional blood flow and impaired cerebrovascular reserve capacity can justify the surgical or endovascular intervention, leaving the procedural complication aside.
Decreased cerebrovascular reserve capacity has been assessed by single photon emission computed tomography (SPECT) scan with administration of cerebrovascular vasodilator such as acetazolamide (ACZ). However, its low image resolution and inconvenience in performance are major drawbacks in general10). Meanwhile, perfusion computed tomography (PCT) imaging has shown relatively high resolution power. Besides it can be performed easily, PCT provides multiple perfusion parameters such as cerebral blood flow (CBF), mean transit time (MTT), and cerebral blood volume (CBV)2,3,5,7,14,22). We used PCT with ACZ challenge to assess the change of cerebrovascular perfusion before and after treatment for the patients with unilateral cerebrovascular stenotic lesions in the anterior circulation.
MATERIALS AND METHODS
Patient selection
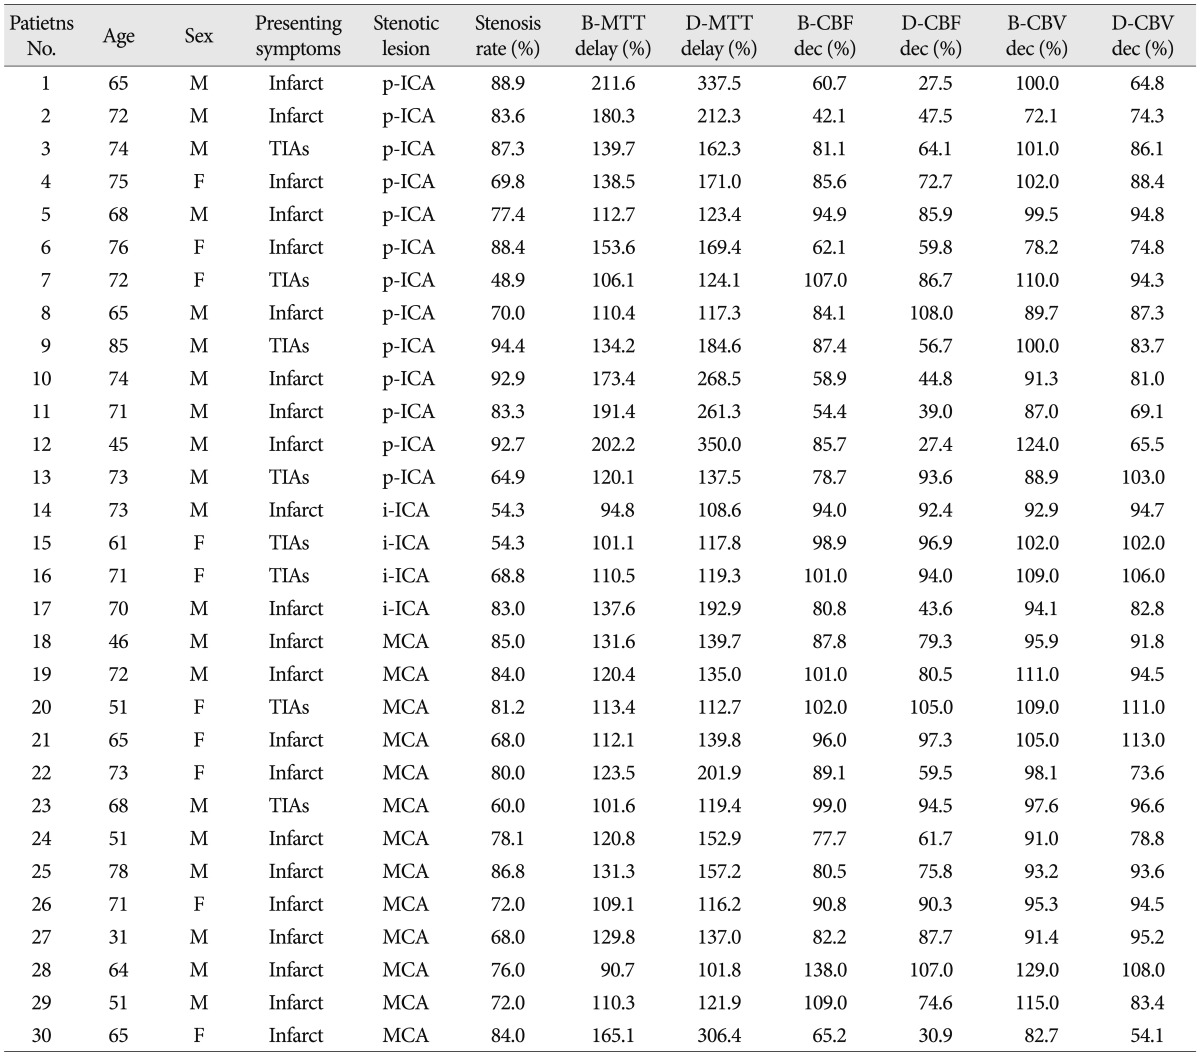
From August 2007 to May 2010, 30 patients (20 men, 10 women) underwent PCT scans with ACZ challenge. Patients ranged from 31 to 85 years of age (mean±standard deviation : 65.8±11.7 years). Thirteen patients had stenotic lesions in proximal cervical internal cerebral artery (ICA), 4 patients in intracranial ICA, and the other 13 patients in proximal middle cerebral artery (MCA). We typically require that candidates for this study have only one symptomatic stenotic lesion in unilateral anterior circulation (ICA or MCA), which is confirmed through catheter angiography. The symptoms were acute or subacute infarctions or transient ischemic attacks (TIAs). And as a matter of course, there was no other stenotic lesion on both sides of cerebral vasculatures. The other exclusion criteria were histories of previous infarction, trauma, or mass lesions that can influence the results of the perfusion imaging. Twenty-two patients had ipsilateral border-zone infarct before PCT scan (2 to 71 days, mean 17.7±18.1 days), and the other eight patients had symptoms of TIAs related to stenotic lesion (Table 1, Fig. 1).
Descriptive data of all patients in this study
Imaging protocol
PCT scans were performed on a CT unit equipped with a 16-detector array (LightSpeed, GE Healthcare, Milwaukee, WI, USA). After non-enhanced CT of the whole brain, 4 adjacent 5-mm-thick sections were selected at the level of the basal ganglia that covered all 3 vascular territories; anterior, middle and posterior cerebral arteries. A bolus of 50 mL of iodinated contrast material (Ultravist 300 mol) was injected at a rate of 4.0 mL/s into an antecubital vein with a power injector. At 10 seconds after the injection, dynamic (continuous) scanning was initiated with the following technique : 120 kVp, 60 mA, 4×5 mm-thick sections, and 1-second per rotation for 50 seconds. The 1-second images were reformatted at 0.5-second intervals, and the 5-mm-thick sections were reformatted into two 10-mm-thick sections. PCT was performed repeatedly after the so-called baseline PCT, approximately 15 minutes after intravenous bolus injection of 1 g of ACZ. With the aid of the skin marks, the same section could be obtained reliably. The perfusion images were generated using the anterior cerebral artery (ACA) contralateral to the stenosis as arterial input and superior sagittal sinus as the venous outflow to maintain a constant technique. The regions of interest (ROIs) were drawn as expected territories of the ACA, MCA and posterior cerebral artery (PCA) and contralateral ROIs were also drawn as mirrored images generated by cine data set by using a workstation (Advantage Windows, GE Healthcare) with PCT software. From each map of ROIs, the absolute values of the MTT, CBF, and CBV were calculated (Fig. 2).
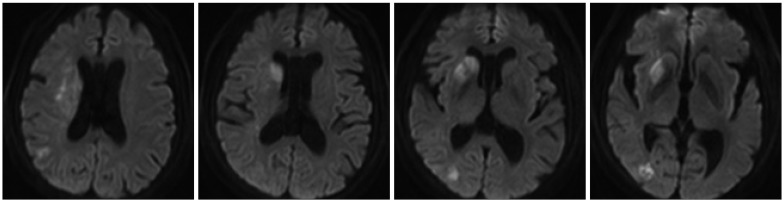
Pre- and post-angioplasty mean transit time (MTT) maps before and after acetazolamide (ACZ) challenge. A : Pre-angioplasty MTT map before ACZ challenge. The hemispheric ratio of right middle cerebral artery (MCA) territory versus left MCA territory is 165.1%. B : Pre-angioplasty MTT map after ACZ challenge. The hemispheric ratio is 306.4%. C : Post-angioplasty MTT map before ACZ challenge. The hemispheric ratio of right MCA territory versus left MCA territory is 112.2%. D : Post-angioplasty MTT map after ACZ challenge. The hemispheric ratio is 117.3%.
The cerebral hemodynamic status was also assessed by hemispheric ratio and percent changes only in the MCA territories. Hemispheric ratio was determined by dividing the absolute values in the stenotic hemispheres by those in the non-stenotic sides. The hemispheric ratio changes in each hemisphere were calculated as follows : ratio changes (%)=(parametersACZ - parametersBaseline)/parametersBaseline×100, where parameterBaseline and parametersACZ represented parameters before and after intravenous injection of ACZ, respectively. Two-tailed paired t-tests were used to 1) compare mean perfusion parameter values in stenotic hemispheres with those in non-stenotic sides, 2) compare the mean MTT, CBF, and CBV hemispheric ratios before injection of ACZ with those after challenge, and 3) compare mean perfusion parameter values before and after angioplasty.
Measurement of stenosis
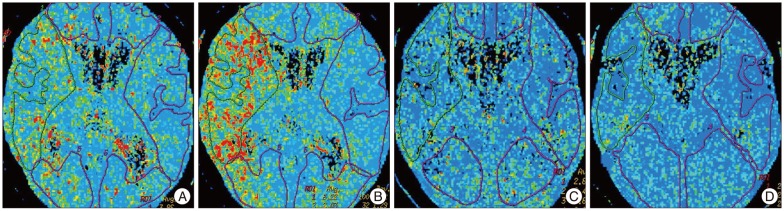
All digital subtraction angiograms were analyzed by a neurosurgeon and a neuroradiologist. The angiographic working view was identified during angiography that best demonstrated the stenotic lesion, the guiding catheter and the disease-free distal artery. The degree of stenosis was calculated as percent stenosis from the catheter angiogram using the following formula : percent stenosis (%)=100×(1-S/N), where S is the diameter of the residual lumen at the point of maximum stenosis and N is the width of the disease-free distal artery at the point where the vessel walls were approximately parallel (Fig. 3).
Right internal cerebral artery (ICA) angiograms before (A) and after (B) stent-angioplasty. A : Right ICA angiogram shows severe stenosis of middle cerebral artery (MCA) up to 84%. B : The stenotic lesion was fully recovered after stent-angioplasty.
Statistical analysis
All data were expressed as the mean±standard deviation of the mean. We compared continuous variables by using Student's t-tests and compared categorical variables by using Pearson's chi-square tests. Comparisons were made according to confidence intervals of 95%. A probability value less than 0.05 was considered statistically significant. All statistical tests were two-sided and all analyses were performed using statistical software (SPSS for Windows, 15.0 standard version, IBM, NY, USA).
RESULTS
Angiographic findings and stent-angioplasty
The stenotic rate ranged from 48.9 to 94.4 percent (mean 76.6±11.9%). We attempted to administer stent-angioplasty in all 30 patients, after pre-procedural PCT evaluation. Stent-angioplasty were successful in 28 patients (93.3%) with nearly zero percent of residual stenosis, but failed in two patients due to too tight and tortuous stenosis to be capable of wire passage in proximal cervical ICA stenosis and severe tortuous course of ICA siphon incapable of stent delivery in MCA stenosis, respectively. There were two cases of peri-procedural complications, the first case was procedure-related thromboembolism in MCA stenting and the other was post-procedural pneumonia due to poor general condition in proximal ICA stenting.
Comparisons of parameters before angioplasty
Of 30 patients with unilateral cerebrovascular stenosis, 28 patients had greater MTT values on stenotic sides than contralateral non-stenotic side before ACZ challenge, however all patients had greater MTT value after ACZ challenge, and MTT values were changed (i.e. increased more than the value before ACZ challenge) after ACZ challenge in 29 patients (Table 1). Twenty-four patients had lower CBF values on stenotic sides than non-stenotic side before ACZ challenge, but 27 patients had lower CBF values after ACZ challenge. CBF values were changed (i.e. decreased more than the value before ACZ challenge) after ACZ challenge in 24 patients. In case of CBV, only 17 patients had lower CBV values on stenotic sides than non-stenotic side before ACZ challenge, but 24 patients had lower CBV values after ACZ challenge. Meanwhile, CBV values were changed (i.e. decreased more than the value before ACZ challenge) after ACZ challenge in 22 patients.
The mean values of the hemispheric ratios before and after ACZ challenge are shown in Table 2. Statistically significant increases in mean MTT ratio and decrease in CBF and CBV ratio were demonstrated after ACZ challenge. There were also linear relationships between the rate of stenosis and each hemispheric ratio before and after ACZ challenge and linear regression plots of the stenosis rate versus each parameter were shown in Fig. 4.
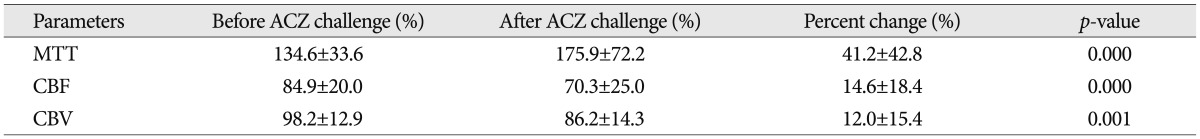
Comparison of values of ROI ratios in pre-angioplasty perfusion CT before and after acetazolamide (ACZ) challenges (n=30)
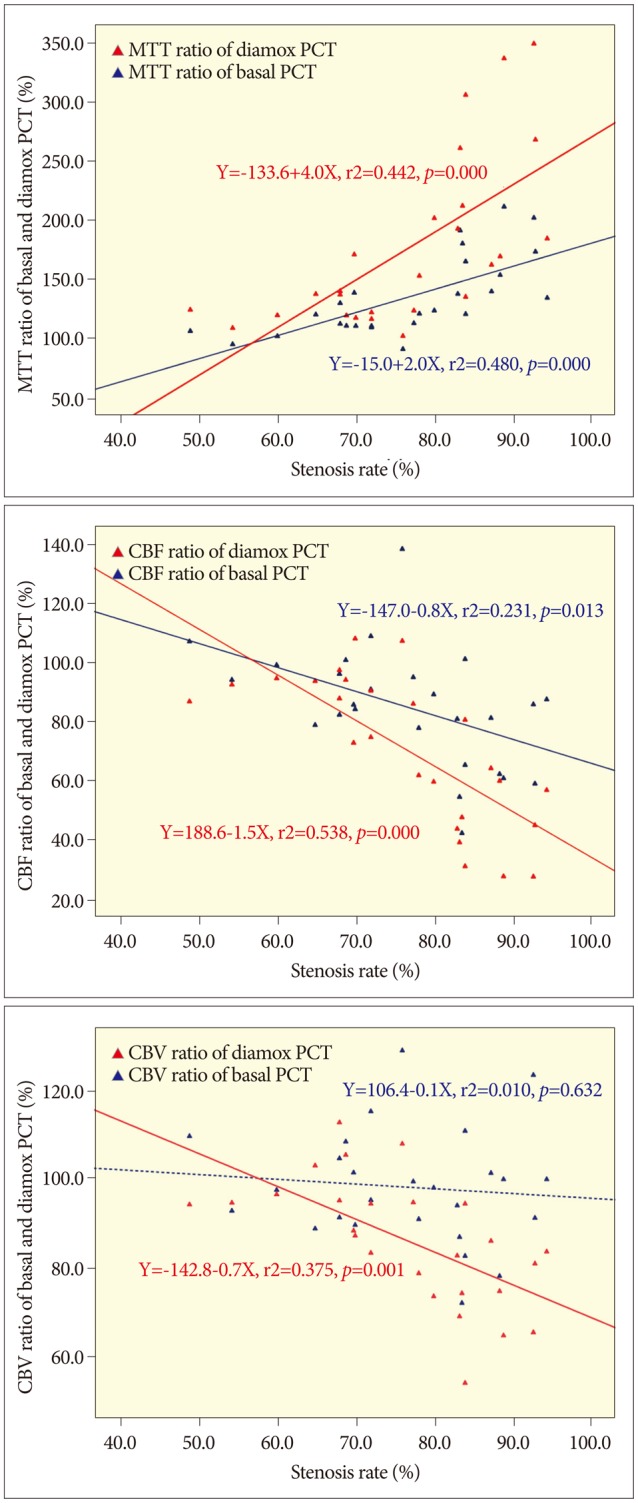
Linear regression plots of each parameter before angioplasty. A : Mean transit time (MTT) ratio shows positive linear relationship with the stenosis rate before acetazolamide (ACZ) challenge (Basal MTT), and the gradient is steeper after acetazolamide challenge (Diamox MTT). B : Cerebral blood flow (CBF) ratio before ACZ challenge (Basal CBF) shows negative linear relationship, and the gradient is steeper after ACZ challenge (Diamox CBF). C : Cerebral blood volume (CBV) ratio before ACZ challenge (Basal CBV) does not show significant linear relationship, however it shows significant negative relationship after ACZ challenge (Diamox CBV). Blue dot and line : values before ACZ challenge. Red dot and line: values after ACZ challenge.
We also compared the mean value of the hemispheric ratio according to the stenosis rate. When we specified the standard stenosis rate as 70% and found significant differences between the group of patients with stenosis rate below 70% and above 70% (Table 3). However, there were less significant differences when we specified the standard stenosis rate as 80%, especially in the comparison of the amount of hemispheric ratio changes (i.e. differences between the ROI ratios before and after ACZ challenge).
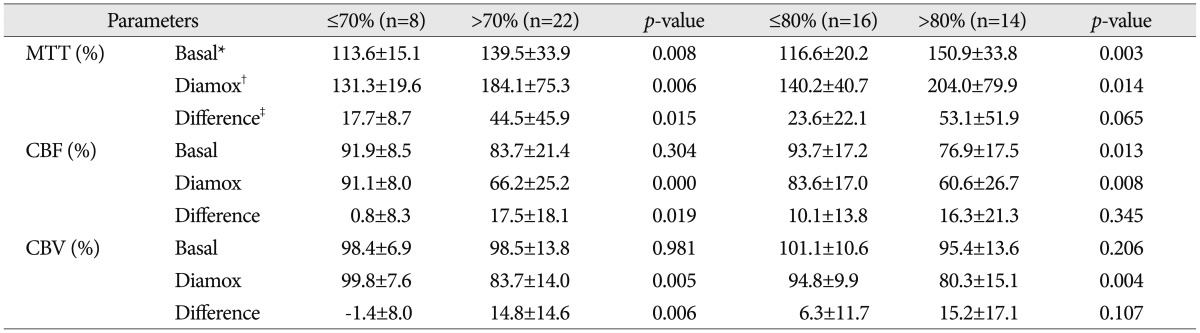
Comparison of ROI ratios according to the specified standard stenosis rates (70% and 80%)
Meanwhile, even though most patients included in this study had relatively poor collateral circulations, it was very difficult to classify the degree of the collateral circulations quantitatively. However, we found interesting results in the comparisons according to the degree of symptom severity and proximity of the lesion site. When we compared the ROIs ratio according to the presenting symptoms (infarct vs. TIAs), stenosis rate itself did not differ significantly between these two divided groups, but all the ROI ratios of MTT were increased more in the patients presented with infarct than the patients with TIAs (Table 4). However, when compared according to the proximity of the lesions (ICA vs. MCA), there was no difference between these two divided groups (Table 5).
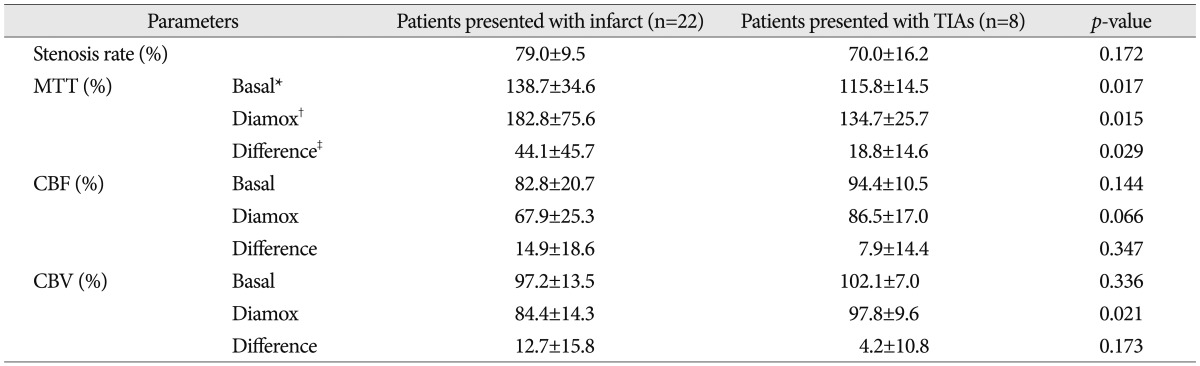
Comparisons of ROI ratios between the patients presented with infarct and transient ischemic attacks (TIAs) (n=30)
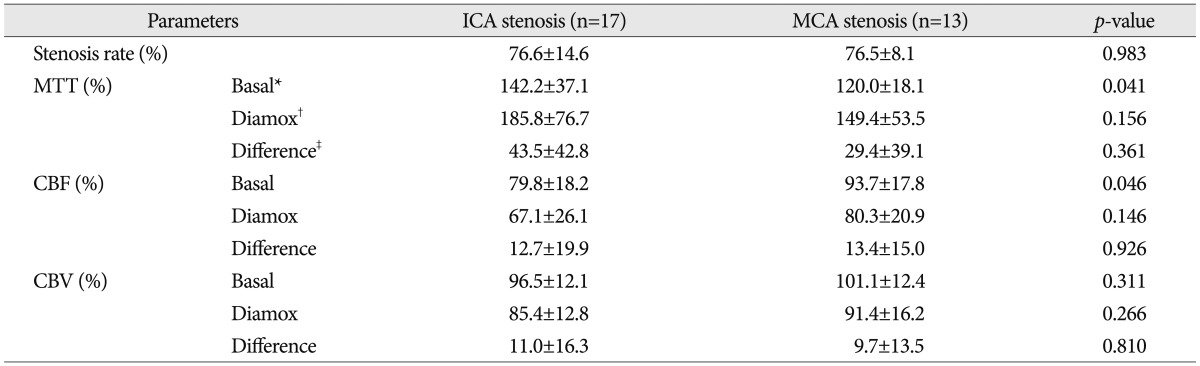
Comparisons of ROI ratio between the patients with internal cerebral artery stenosis (ICA) stenosis and middle cerebral artery (MCA) stenosis
Comparisons of parameters after angioplasty
Among 30 patients, only 24 patients (80.0%) underwent PCT in 2 days after angioplasty. Perfusion study was not necessary in two patients in whom we failed to do stent-angioplasty, and in two patients with peri-procedural complications described above, it was impossible. The other two patients refused post-procedural perfusion study due to personal reasons.
Of 24 patients who had been conducted follow up PCT after angioplasty, 16 patients had greater MTT values on stenotic sides than non-stenotic side before ACZ challenge, and 20 patients had greater MTT value after ACZ challenge. Meanwhile, MTT values were changed after ACZ challenge in 18 patients. Thirteen patients had lower CBF values on stenotic sides than non-stenotic side before ACZ challenge, and 15 patients had lower CBF values after ACZ challenge. CBF values were changed after ACZ challenge in 14 patients. Eight patients had lower CBV values on stenotic sides than non-stenotic side before ACZ challenge, and 12 patients had lower CBV values after ACZ challenges. CBV values were changed after ACZ challenge in 16 patients.
The mean values of the hemispheric ratios before and after ACZ challenge are shown in Table 6. No significant differences were found with respect to MTT and CBF ratio. In case of CBV ratio, though the difference reached statistical significance, it was weaker than that in the pre-procedural ratio comparisons.
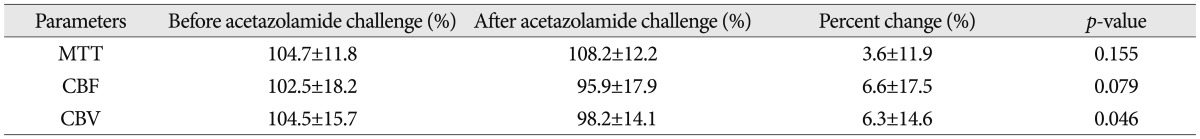
Comparison of ROI ratios in post-angioplasty perfusion CT before and after acetazolamide challenge (n=24)
Comparisons of parameters before and after angioplasty
There were significant differences between pre-procedural and post-procedural PCT values only except baseline CBV ratio (Table 7). However, the amount of percent change after ACZ challenge was different significantly only in case of MTT ratio.
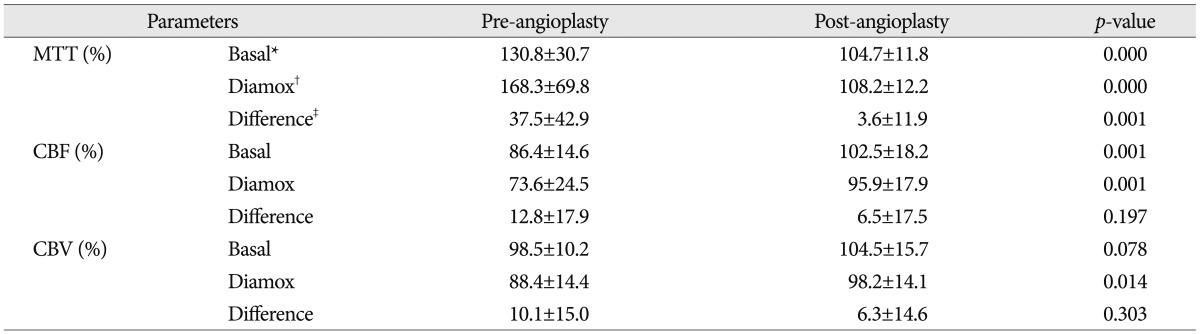
Comparisons of ROI ratios between pre-angioplasty and post-angioplasty perfusion CT before and after acetazolamide (ACZ) challenges (n=24)
DISCUSSION
Because the indications of endovascular treatment such as stent-angioplasty have been controversial until now, especially for intracranial stenosis, it is important to rely on valid and objective imaging study, even when the treatment appears to be clinically inevitable6). All the subjects of this imaging study were patients with symptomatic unilateral anterior cerebral stenosis, not occlusion, because the aim of this study is to evaluate the feasibility of PCT to assess cerebral hemodynamics in patients with unilateral stenosis of anterior cerebral circulation. The CT scanners used to perform PCT studies are available in most hospital, and PCT studies, even combined with acetazolamide challenge, are also rapid and require little time to post-process2,8,10,13,14,17,18). Besides, the quantitative results potentially available with PCT such as hemispheric ratios of CBF, CBV and MTT may also be an added advantage of PCT.
In the present study, the percent changes of each value of PCT after ACZ challenge were correlated well with the unilateral stenosis before angioplasty (Table 2). And then these changes were almost disappeared after angioplasty (Table 6, 7). These findings may be helpful to neurologists, neurosurgeons, and neurointerventionists when they should decide whether to attempt revascularization therapy for these stenotic diseases or not.
However, PCT with ACZ challenge has several limitations in the interpretation of the results. First of all, the accurate ROIs of vessel territories are variable according to vascular anatomic and physiologic circumstances of each patients9). To complement this limitation, in this study, all the PCT maps and ROIs were drawn manually by a well-trained neurosurgeon without automatic software aid, because of the anatomical variability according to each patient. The standard cross section was a transverse section through the level of the basal ganglia which best displayed not only the representative territories of MCA, but also ACA and PCA, therefore offering the opportunity to find abnormalities in each of these major vascular territories. Hand-drawn ROIs of MCA territory included basal ganglia because the most MCA (M1) stenotic lesions, in this study, were covered or before lenticulostriate arteries and the others were proximal to MCA i.e. ICA.
Second, PCT imaging cannot reflect exactly the physiologic status of viable cells but only the anatomical patency of vasculature, however multiple studies have revealed that the values from PCT are correlated well with the clinical setting1,4,23). And then PCT with ACZ challenge provides satisfactory and reliable data for assessing cerebral hemodynamic reserve in a manner similar to that used in SPECT, and xenon CT12,15,16,25,26).
There were several interesting points in the results of this study. MTT and/or time to peak have been known to be very sensitive to hemodynamic changes such as arterial stenosis or occlusion, and these were also same in our study8,17,24). Meanwhile, CBV is known to remain unchanged or even increase despite a decrease in CBF in the early stage of ischemia21). However, in this study, it appeared that CBV before ACZ challenge was nearly unchanged and then showed a strong tendency to decrease after ACZ challenge. We attribute these differences to the hemodynamic status of patients included in this study. All the patients had ischemic symptoms after long standing atherosclerotic stenosis, not due to acute occlusion such as thromboembolism. Therefore, the mechanism of autoregulation i.e. vascular reserve capacity might already deplete, and consequently could no longer compensate for a further reduction in CBF. CBV accordingly might also decrease. This simultaneous decrease of CBF and CBV means oligemic tissue status with insufficient compensation21).
Vascular reserve capacity, meanwhile, is manly determined by collateral circulations in steno-occlusive diseases, and accordingly the CBF status. However, we could not classify the degree of the collateral circulations objectively, because quantitative measuring was nearly impossible with preoperative conventional angiograms. Given this fact, it would be a major limitation of this perfusion study. Therefore we attempted to compare ROIs ratio according to the degree of symptom severity and proximity of the lesion site. All the ROIs ratios of MTT were more increased in the patients presented with infarct than the others, and ROIs ratio of CBF and CBV were decreased more at least after ACZ challenge (Table 4). Considering the stenosis rates of both groups were not different significantly, symptom severity is suspected to be associated with the degree of the collateral circulations. Meanwhile, comparison according to the proximity of the lesions (ICA vs. MCA) didn't show any difference between the groups only except ROIs of MTT before ACZ challenge (Table 5). This result may mean all the patients included in this study have much the similar degree of collateral circulations, regardless of lesion site.
The most important result of current study is the linear relationship between the rate of stenosis and each hemispheric ratio before and after ACZ challenge (Fig. 4). Therefore, we suspected that cerebral perfusion status is in inverse proportion to the rate of arterial stenosis as a precondition of symptomatic severe stenosis. Besides, there was also a linear relationship between the stenosis rate and the hemispheric ratio change (i.e. hemispheric ratio after ACZ challenge-hemispheric ratio before ACZ challenge) (Fig. 5). This hemispheric ratio change may mean a corresponding reserve capacity, though not the exactly same one. Then, if so, the amount of ratio change above zero may mean the depletion of reservoir capacity, and the cases with stenosis rate about 60% or more were suspected to be depleted reservoir capacity in Fig. 5. The hemispheric ratio change of MTT was roughly 25%, and that of CBF and CBV were 10% at the point of 70% of stenosis rate. Therefore, when we specified the standard stenosis rate as 70%, we found significant differences of all three PCT values between the two divided groups (Table 3). However, when we specified the standard stenosis rate as 80%, there were lesser significant differences between the two divided groups especially in the comparison of the amount of hemispheric ratio changes (i.e. differences between the ROI ratios before and after ACZ challenge). It is suspected that the patients with severe stenosis over 70% and relevant symptoms may have reasonable depletion of reserve capacity.
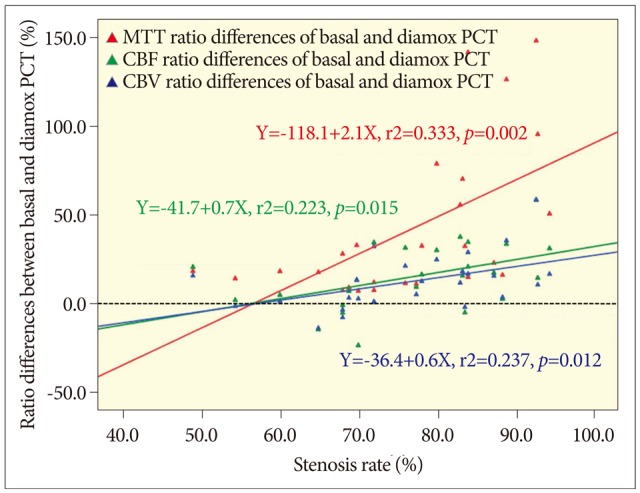
Linear regression plots of each parameter's hemispheric ratio change {absolute value of ratio difference=[hemispheric ratio after acetazolamide (ACZ) challenge-hemispheric ratio before ACZ challenge]} versus stenosis rate. The degrees of all the three parameters' ratio changes show positive linear relationships with the stenosis rate. The horizontal black dotted line indicates zero percent of hemispheric ratio change, and all the three lines cross with the horizontal black dotted line at near 60& of stenosis rate, and continue to rise. The gradient of mean transit time (MTT) is steeper than the others. Red dot and line : MTT. Green dot and line : cerebral blood flow (CBF). Blue dot and line: cerebral blood volume (CBV).
Almost all data were changed dramatically after angioplasty, and the ratio differences of each PCT values were disappeared (Table 6). And then, in the comparison between pre- and post-procedural PCT parameters, most parameters showed noticeable differences, of course, MTT value was the most prominent one (Table 7). Therefore these PCT imaging might be useful for not only preoperative evaluation, but also postoperative follow-up evaluation of CBF status and even predictions of hemodynamic changes such as restenosis before conventional angiography.
CONCLUSION
PCT with ACZ challenge appears to be a useful tool to evaluate patients with unilateral anterior circulation stenosis, especially when we would decide to administer angioplasty and evaluate postoperative follow-up status. We could not define the exact cut-off value of hemispheric ratio change because the number of patients included was relatively small and this study is only an imaging study rather than a controlled clinical study. However, patients with symptomatic severe stenosis over 70% are showed meaningful decrease in cerebral perfusion, and the more severe the symptoms were, the more prominent the perfusion decreased.