INTRODUCTION
It was in 1936 when Costello first described pituitary incidentalomas (PIs) that they occurred with the remarkable frequency of 22.5% [4]. Since then, his investigation has been cited and reexamined in numerous publications. The prevalence of PIs in autopsy series is known to be around 3-27% [3,18,20] and on imaging studies around 10% [10,12,17]. Although, PIs are common in clinical practice, little is known about the long-term natural history.
Pituitary adenomas (PAs) are not usually associated with clinical syndromes related to hormone excess and may be discovered occasionally, when they are not hormonally active [13]. So, they usually escape early diagnosis and are mainly discovered when they exert mass effects on surrounding tissues leading to visual impairments, headache and hypopituitarism [9]. The option for treatment for patients with symptomatic PAs is debulking surgery, but, in the absence of mass effects, a ŌĆ£wait and seeŌĆØ approach with a serial evaluation of tumor growth and visual function could be a possible therapeutic choice [8]. However, patient series systematically reporting the PAs outcome that were not treated either surgically, medically, or with radiotherapy during long-term follow-ups are scarce [8,13].
The aim of this study was to evaluate the natural history and growth pattern of untreated nonfunctioning PAs, as well as to assess clinico-radiologic prognostic factors, using 3-dimensional volumetric analysis. Proper understanding of these features is imperative to guide treatment consensus for patients with PAs.
MATERIALS AND METHODS
Patient selection
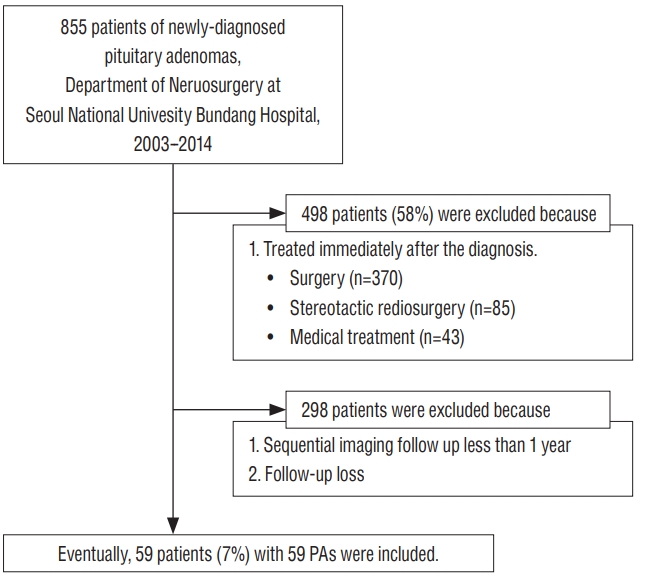
This was a retrospective cohort study of patients with PAs under observation without any therapeutic intervention. Between July 2003 and December 2014, 855 patients were newly diagnosed as PAs at Seoul National University Bundang Hospital. This study was approved by the ethical committee of authorsŌĆÖ institution (IRB No. B-1807/483-105). Our inclusion criteria of this study were as follows : 1) magnetic resonance imaging (MRI) definitely suggestive of PA, neither RathkeŌĆÖs cleft cyst nor other sellar tumors; 2) at least two sequential radiological follow-ups over a minimum interval of 12 months; 3) at least one complete clinical and biochemical assessment; and 4) conservative management without any intervention. Of a total population, 498 patients (58%) were placed in a treatment group immediately after diagnosis and 298 patients (35%) were with either inappropriate medical records or absence of follow up images. Excluding these patients, the remaining 59 patients (7%) were managed with clinico-radiological follow-up for longer than 12 months without any kind of therapeutic intervention (Fig. 1). They were observed with a ŌĆ£wait-and-seeŌĆØ policy and included as final analysis.
Volumetric measurements
Tumor size was measured volumetrically using the initial and the last follow-up MRI, and tumor growth during the observation period was determined. Using a stereological method according to the Cavalieri principle, the three-dimensional tumor volumes were calculated from two-dimensional images [16]. The volume of the tumor was estimated from the volumetric measurement of the coronal plane Gadolinium-enhanced T1-weighted MRI with the slice thickness of 2 mm. The tumor area was figured out by tracing its contour on each MRI slices using the Picture Archiving and Communication System (version 3.0.9.1 BN 13, 2005; INFINITT Healthcare Co. Ltd., Seoul, Korea). Then, the volume was calculated by multiplying the sum of the areas by the slice thickness. The accuracy of measurements by this method has been validated in previous studies [11,21]. For comparison, we measured the greatest tumor diameter on two-dimensional plane at the initial and the last follow-up MRI. We analyzed the distance between tumor and optic chiasm to determine how it affects the patient outcome.
We identified the factors associated with relatively rapid tumor growth. The definition of significant tumor growth in previous studies has shown wide variability. We believe that the rate of tumor growth is of a greater clinical importance than the extent of growth. So, we divided the PAs into the growth and stable tumor group according to the mean tumor growth rate.
Statistical analysis
All statistical analyses were performed using SPSS version 21 (IBM, Chicago, IL, USA). The categorical variables were analyzed using Pearson chi-square test and FisherŌĆÖs exact test. The continuous variables were presented as the mean┬▒standard deviation for parametric data. For an intergroup comparison, StudentŌĆÖs t-test was used for parametric data and the Mann-Whitney U test for non-parametric data. The cut-off value was the point closest to the point of perfect classification (sensitivity and specificity), as determined by using a receiver operating characteristic (ROC) curve with a discrimination power. Cox proportional hazards regression was used to determine the hazards ratio for the eventual treatment group.
Variables associated with a dependent variable in univariate analysis (p<0.10) were then included into a multivariate analysis. A multivariate analysis was performed using logistic regression analysis with a backward stepwise method. p values of less than 0.05 were considered significant.
RESULTS
Characteristics of study population
Thirty-one patients (53%) were female. The mean age was 64.4 years and mean follow-up duration was 46.8 months. Most of tumors were incidental findings. Of the 59 patients, 47 patients (80%) had no symptoms at all; nine patients (15%) had clinical headache, which was not related with tumor and was controlled without any treatment; two patients (3%) had visual symptoms, of whom only one patient had an evidence of optic nerve compression, but was reluctant to surgery; one patient (2%) showed clinical galactorrhea, but the prolactin level was within normal range. Fifty-eight patients (98%) had non-functioning PAs. The remaining one patients (2%) had a suspicious prolactinoma, but was reluctant to any treatment modality including hormone therapy. So, about the reason for observation, 56 patients (95%) had no tumor-related symptoms or neurologic signs, two patients (3%) were reluctant to treatment, and one patient (2%) had poor systemic condition to undergo surgery. The demographic information and clinical features of our study population are presented in Table 1.
Volumetric analysis of tumor size
The volumetric characteristics of the 59 PAs are provided in Table 1. The mean initial tumor volume and diameter were 1.83┬▒2.97 mL and 13.77┬▒6.45 mm, and the mean last tumor volume and diameter were 2.85┬▒4.47 mL and 15.75┬▒8.08 mm, respectively. The mean distance between tumor and optic chiasm was 1.86 mm at the initial MRI and 1.32 mm at the last follow-up MRI. The mean annual tumor growth rate was 0.34┬▒0.68 mL/yr. The most appropriate cut-off point for mean tumor growth rate using ROC curve was 0.29 mL/yr (area under curve [AUC], 0.774; 95% confidence interval [CI], 0.639-0.908; p =0.029). It was almost alike with the mean tumor growth rate, so we divided the growth and stable tumor group according to the mean growth rate value of 0.3 mL/yr. Sixteen (27%) PAs exhibited growth rate over 0.3 mL/yr and they were classified as the growth group. The other 43 patients (73%) were classified as the stable group.
Table 2 shows predictive factors for tumor growth. The initial tumor size (hazard ratio [HR], 1.140; 95% CI, 1.003-1.295; p=0.045) was the only independent predictor that significantly determined the tumor growth. PAs with lobulating contour and initial tumor volume trended toward, but showed no statistical significance by multivariate analysis. No other clinical or radiological characteristics showed statistical significance.
Clinico-radiological factors of clinical outcome
After excluding three patients who needed treatment at presentation from our total population, we could determine the natural course of 56 patients with non-symptomatic nonfunctioning PAs. They showed no clinical and biochemical evidence of hormone excess at the time of diagnosis. Among 56 conservatively managed patients, six patients (11%) with both obvious tumor growth and de novo symptom underwent surgical removal with a mean interval of 34.5┬▒23.0 months from diagnosis to treatment. The remaining 50 patients (89%) were still maintained with conservative management during the follow-up periods of 48.1┬▒30.9 months. For the hormonal function assessment, all but one patient had no hormonal dysfunction : only one patient experienced increase of prolactin, due to stalk-resection effect as tumor grew. In the meantime, there were no pituitary apoplexy among out cohort during observation periods. Clinico-radiological characteristics of both groups are provided in Table 3.
The whole patients of both groups were diagnosed with PAs incidentally : no one had tumor-related symptom at first. Clinical characteristics, such as age or sex, showed no significant differences between each group. There were no significant differences in volumetric characteristics : initial tumor volume, last tumor volume, or mean growth rate were not significant factors. On the contrary, the differences of initial or last tumor size in diameter, and the relationship between tumor and optic chiasm were proved to be significant between each group. The patients who eventually underwent surgery had variable tumor size and distance from tumor to optic chiasm at first. However, on last follow-up MRI, there was no interval between tumor and chiasm. The reason for surgery was due to visual symptom in all six patients : five patients had newly-developed visual field defects and one patient had aggravated visual acuity. It could be said that the patients who underwent surgery had bigger tumor size than the patients who maintain conservative management, and showed no interval between tumor and chiasm on last follow-up MRI.
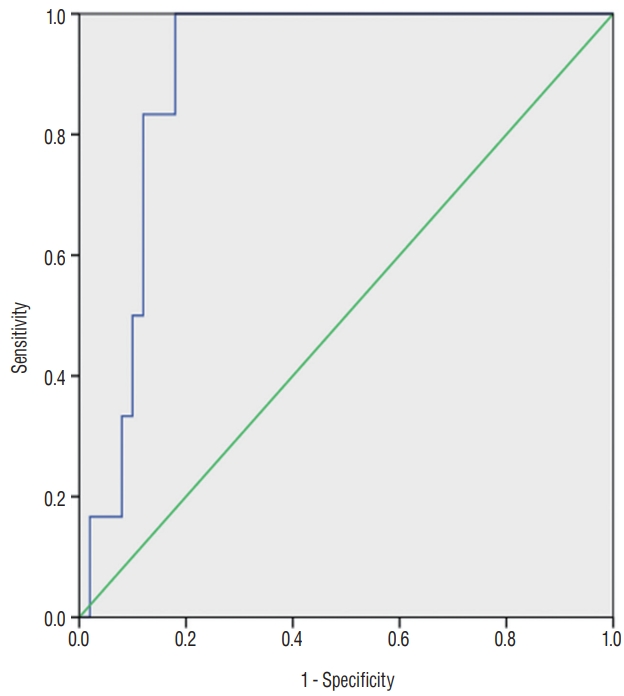
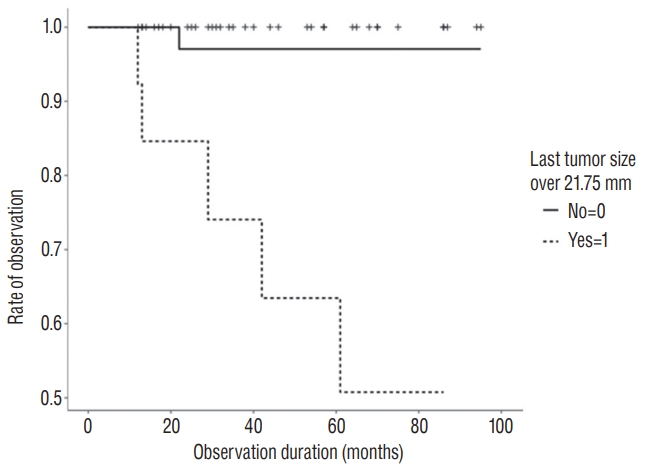
We plotted the ROC curve and determined the most appropriate cut-off value for tumor diameter on last follow-up MRI. Fig. 2 shows that AUC of the tumor diameter on last follow-up MRI was 0.897 (95% CI, 0.814-0.980, p=0.002), and the cutoff value was 21.75 mm. By Cox regression analysis, nonfunctioning PAs of last longest diameter over 21.75 mm were the only significant prognostic factor for eventual treatment (HR, 89.104; 95% CI, 1.631-4867.010; p =0.028; Fig. 3). However, tumor diameter and distance from tumor to optic chiasm on last follow-up MRI were not significant by multivariate analysis (Table 4).
DISCUSSION
Several studies have described the natural history of PAs. However, information about the tumor growth pattern and prognostic factors was inconclusive, because of small sample sizes and the variety of the methods used to measure the tumor growth. This study added to the literature for the following. Our analysis revealed that linear diameter was more significant to detect tumor growth rather than volume. It could be easily estimated that not the volume itself, but the longest diameter affects the optic nerve apparatus and then finally, the visual symptoms. In many previous studies, it was visual impairment that determined the eventual intervention among the conservatively managed PAs [5]. So, the longest diameter rather than volume determined the eventual treatment group.
Additionally, we analyzed that PAs of the longest diameter on last follow-up MRI over 21.75 mm were the only significant prognostic factor for eventual treatment. Several previous studies described the factors for tumor growth with PAs : macroadenomas rather than microadenomas and solid lesions [2,7,11,14,15,17]. But, there was no definite consensus to define the tumor size to determine the treatment. Moreover, to date, there was no data how big is enough to determine the eventual intervention among the conservatively managed patients. Our study suggested one possible factor. The knowledge of natural history of a disease is crucial in determining the appropriate clinical management of the patient.
In overall, the presumed nonfunctioning PAs seemed to have a small probability of tumor growth and followed a benign course [1,2,7,19]. Also in our cohort, 73% of conservatively managed PAs remained stable in size and 11% would be likely to be treated eventually during observation periods. Table 5 summarized the literature for the natural course of tumor size in PAs. We can assume that only a minority of nonfunctioning PAs exhibit considerable growth and become clinically relevant, while the majority remain stable or show extremely slow growth velocity [11]. Many previous studies have also proposed a conservative approach with careful follow-ups in patients with PAs without visual or neurological abnormalities [1,6,13,18]. So, the ŌĆśwait-and-seeŌĆÖ policy might seem reasonable for PAs without symptoms.
This study has several limitations. 1) As there is no concrete guideline for deciding ŌĆ£wait-and-seeŌĆØ policy for the nonfunctioning PA, so there might be any discrepancy at the decision for treatment. That is why we define concrete inclusion criteria for this study, considering its retrospective design of this study. The authors are not giving a guarantee of ŌĆ£wait-andseeŌĆØ policy, but showing the possible fate of conservativelymanaged PAs. 2) As this study was performed by a retrospective chart review in a single institute, it could result in selection bias. 3) Only based on MRI findings, the lesions might be not PAs, but possibly be other pathologies. 4) In addition, as we analyzed two sequential imaging follow-ups on our initial impression that PAs exhibit linear growth, the serial images would reveal the exact growth modeling. And 5) the follow-up period of 12 months and longer at minimum is relatively short for tumors of naturally benign course. Further study with a longer follow-up period is a mandatory.
Despite these limitations, our study suggested new possible factor to decide the eventual treatment among patients with PAs. Additionally, our analysis revealed that linear diameter was more significant to detecting tumor growth. It would be more helpful in the clinical significance as well as in a research setting. Further serial image analyses with bigger sample size would be necessary.
CONCLUSION
Seventy-three percentages among PAs on a ŌĆśwait-and-seeŌĆÖ policy showed stable tumor size during observation periods. The initial tumor size of PAs was the independent predictive factor that determined tumor growth. Six patients (11%) of 56 conservatively managed nonfunctioning PAs were likely to be treated eventually. By Cox regression analysis, the longest diameter over 21.75 mm on last follow-up MRI was the significant predictive factor for eventual treatment. Further study with large series is a mandatory.